
12 Classic Chart Patterns Every Trader Should Know
There are hundreds of stock chart patterns. But not all chart patterns are equal.
There’s a handful of chart patterns that traders always look for. These are the classics. Get to know these 12 key patterns. Look for examples of them and save them somewhere you can easily access them. Go back and study them so you can spot them as they’re forming.
Once you learn how to study charts in a technical way, you’ll have a better understanding of price action. We call this technical analysis.
Here are the 12 classic chart patterns you need to know.
#1: The Cup and Handle
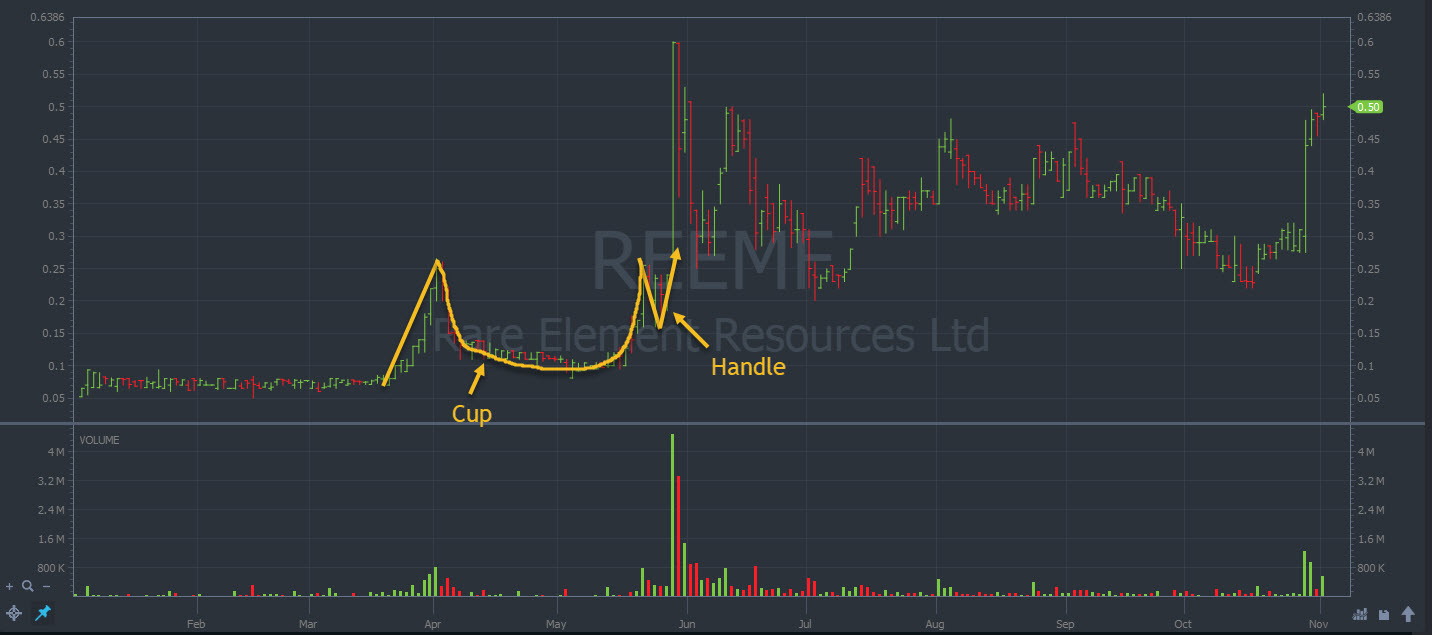 Rare Element Resources (OTCQB: REEMF) showing a cup and handle pattern (Source: StocksToTrade)
The cup and handle pattern is a popular breakout pattern.
The price comes up and sets a high. It then falls back and sets a base. It comes back to the first high and pulls back again, but not to the original base. It rebounds off a higher low and breaks out.
The rounded bottom is the cup. That’s the first base. The handle is where we see the higher low.
#2: The Rounding Bottom
The rounding bottom signals a reversal and can lead to a breakout.
This looks the way it sounds. The stock comes up to a resistance level, Then pulls back.
It softly downtrends to support before forming a gentle uptrend. If it helps, you could picture a bowl.
This is also called an ABCD pattern.
The example below is from Adial Pharmaceuticals, Inc. (NASDAQ: ADIL.) Matt Monaco called this out in Small Cap Rockets as it was happening. (Past performance is not indicative of future results.) The right team and the right tools can help you study these plays in real-time.
 Adial Pharmaceuticals, Inc. (NASDAQ: ADIL) showing a rounding bottom pattern (Source: StocksToTrade)
#3: The Double Top
 Armstrong World Industries (NYSE: AWI) showing a double top pattern (Source: StocksToTrade)
A double top is a basic but powerful reversal pattern. We see this pattern when an uptrending market tests a level, pulls back, then tests that level again. It fails to break through, and the price falls back down.
The two highs are around the same price — that’s why we call it a double top. The double top pattern happens when the market doesn’t have enough bullish momentum.
This pattern can signal the end of an uptrend — at least for the time being. You can expect the price to either trade in a range or begin a downtrend.
#4: Double Bottom
Double bottoms fall into the reversal category.
As the name implies, this is a pattern with two bottoms. The price falls and comes back up. Later, it tests the bottom again. But it finds support and moves back up. Two bottoms. Zomedica Corp. (NYSE: ZOM) showing a double bottom pattern (Source: StocksToTrade)
Keep an eye on the place where it bottomed twice. That’s now a key level.
#5: The Supernova

Viveve Medical Inc. (NASDAQ: VIVE) showing a supernova pattern (Source: StocksToTrade)
The supernova is a favourite among low volume coins/stocks
This breakout pattern plays out a lot in penny stocks. Especially with heavily shorted, low float stocks.
Why? Well, small-cap stocks don’t need much buying power to run. These kinds of moves are less common in large-cap stocks.
The supernova often happens when a stock gets hyped up. That hype could come from major news catalysts, rumors, or the breakout itself.
The hype hits, buyers pile in, and it triggers a short squeeze. These runs are pure hype and short covering. Once the mania dies, the price drops as fast as it went up.
Traders who can spot the supernova early on can ride a quick price rise. But don’t get greedy.
Does the supernova pattern excite you as much as it excites me? These runners blow my mind every time. That’s why I love the StocksToTrade Breaking News Chat. When I see that volume coming in, I don’t have to wonder where the hype is coming from.
#6: The Head and Shoulders
 Uber Technologies Inc. (NYSE: UBER) with a head and shoulders pattern (Source: StocksToTrade)
The head and shoulders pattern is a well-known reversal pattern. It indicates the stock will end its uptrend and head lower.
The head and shoulders pattern looks like the name suggests.
There’s a small price movement upward, then a pullback. Then the price moves above the original resistance before pulling back. Finally, there’s another move upward that stops at the first resistance line.
The two smaller swings are the shoulders, and the big swing in the middle is the head.
Traders often look for the price to drop below the level of the two lows. That’s when traders may close long positions or take short positions.
#7: The Triangle
 Microsoft Corporation (NYSE: MSFT) showing a symmetrical triangle pattern (Source: StocksToTrade)
Triangles are a common stock chart pattern. The price makes swings that get smaller each time. If you connect lines along the tops and bottoms, they form a triangle.
Triangles are a versatile pattern. Sometimes they precede reversals and continuations, but there are triangle breakout patterns.
Triangle chart patterns come in three distinct types:
- The symmetrical triangle. The top and bottom trend lines are equal distances from the midpoint. Traders often view this as a pause in the market’s momentum before it continues.
- The ascending triangle. The lower trend line is rising, but the top line is horizontal. This can be a breakout pattern, a continuation pattern, or a reversal pattern.
- The descending triangle. The upper trend line slopes down, but the bottom line is horizontal. This type of triangle is a continuation pattern found in downtrends.
Triangles are one of the simplest chart patterns beginners can recognize. If you’re starting out, this is a key pattern to watch for.
#8: The Wedge
The wedge is a kind of triangle. It can signal a breakout or continuation.
A wedge can be an upward or downward wedge. It starts with wide price action that gets tighter. But this action has a clear direction.
Higher lows and higher highs create a bullish wedge. Lower highs and lower lows create a bearish wedge. The top or bottom lines are not as steep as the support or resistance lines.
Imagine an ascending or descending triangle, but the horizontal line is on a slope.  Sundial Growers, Inc. (NASDAQ: SNDL) showing a wedge pattern (Source: StocksToTrade)
#9: The Flag
 Amazon.com Inc. (NASDAQ: AMZN) showing a flag pattern (Source: StocksToTrade)
The flag is another common continuation pattern. Flags can be bullish or bearish.
A bull flag starts with a strong upward move in price. Then buyers relent and the price pulls back, making small up and down moves along the way. Traders see this as a pause in momentum and expect the original trend to soon resume.
A bear flag is just the opposite.
To draw a flag pattern, put a line along each swing high and each swing low. This is another great chart pattern for beginners.
#10: The Pennant
Pennants signal continuation.
As with a bull or bear flag, the price shoots in one direction. This creates a pole. Then the price action pulls back and begins to move up and down. It gets tighter toward the point.
 Cassava Sciences, Inc. (NASDAQ: SAVA) showing both bullish and bearish pennant patterns (Source: StocksToTrade)
If you draw a line across the top and the bottom, you wind up with a long, symmetrical triangle.
#11: The Spring
 Microsoft Corporation (NYSE: MSFT) showing a spring pattern (Source: StocksToTrade)
This reversal stock chart pattern isn’t as well known, but it’s a favorite of many pro traders.
The pattern has a few names — spring, stop-hunt, 2B, pump fake, and fake-out among them.
The market sets a key high or low point, then pulls away. Later, it retests. It flicks through the key high or low before the price falls away again.
It’s like a double-top or double-bottom. But instead, the spring penetrates the original level.
#12: Gaps
When a stock opens above or below its closing price, it creates a gap in the chart. Usually, this results from extended-hours trading. Sometimes trading halts can cause gaps intraday.
While not a pattern per se, this is a common occurrence in the market. A stock can gap above or below a key level. That would be a breakout.
It can also gap in the opposite direction of a trend, signaling a reversal.
 Cassava Sciences, Inc. (NASDAQ: SAVA) showing multiple gaps, including a gap up breakout (Source: StocksToTrade)
This article does not contain investment advice or recommendations. Every investment and trading move involves risk, and readers should conduct their own research when making a decision.