
The Ichimoku Cloud, also known as Ichimoku Kinko Hyo, is a versatile technical analysis indicator that provides an integral view of the market. Use the Ichimoku Cloud trading strategy to find trends, support and resistance levels, and potential reversal points.
Ichimoku users claim the indicator gives a wealth of information compared to other tools: it shows potential support and resistance areas, the price related to sentiment, and its current momentum.
Let’s explore how the Ichimoku Cloud indicator works, what it tells traders about future price direction, and how to use it as a strategy.
What the Ichimoku indicator is, and how it works
The Ichimoku Cloud indicator was developed by Goichi Hosoda, a Japanese journalist, in the late 1930s. He then spent about 30 years perfecting the trading strategy before making it public in the late 1960s. Its original name, Ichimoku Kinko Hyo, translates from Japanese as ‘equilibrium chart at a glance’, highlighting its ability to provide a quick and informative view of market conditions.
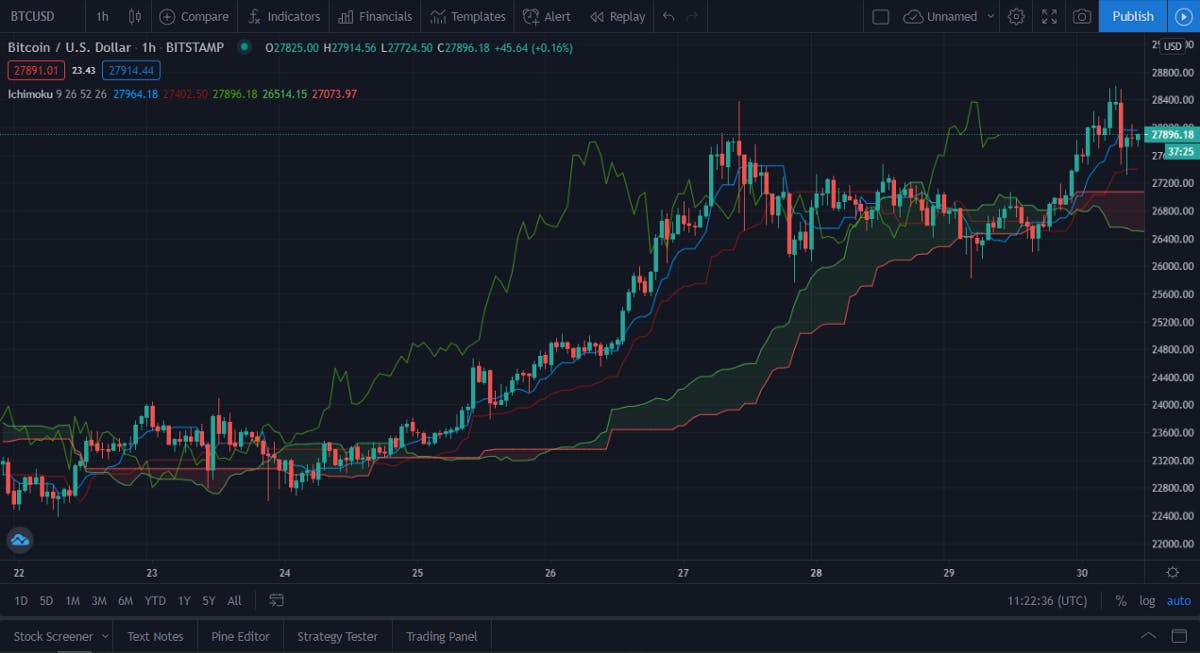
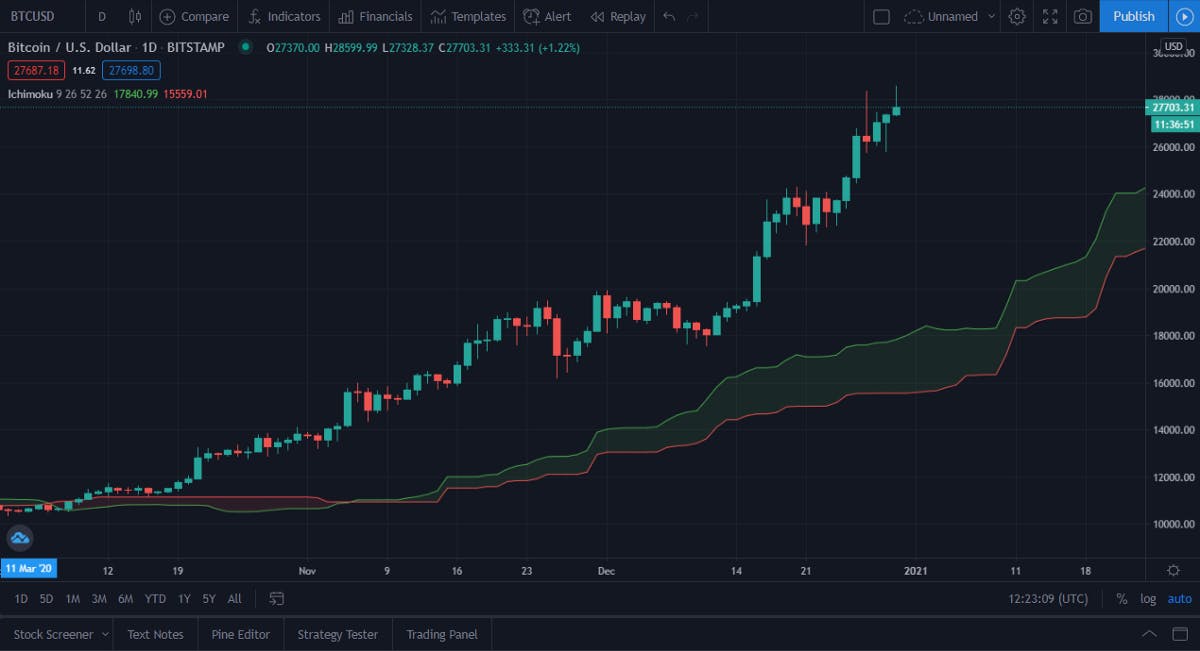
It is clear why this indicator is called the “Ichimoku Cloud.” We can see three lines resembling moving averages (MA) and the cloud itself on the chart.
The Ichimoku cloud consists of 4 components:
- Tenkan-Sen – blue line
- Kijun-Sen – red line of local maximums and minimums (High/Low)
- Chikou Span – brown (or green) line
- Kumo – cloud.
If you want to use the Ichimoku cloud strategy, then you need to understand what each of these components stand for. This is what the next section explores.
Tenkan-Sen
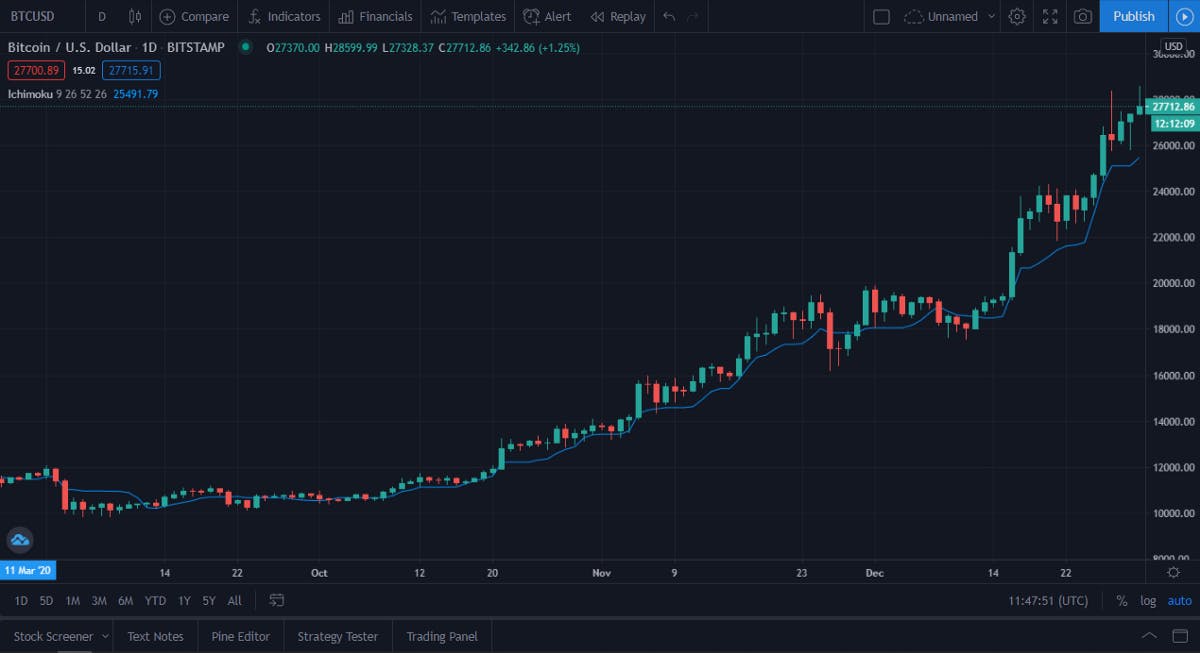
This is the first line of the Ichimoku indicator, marked blue on the chart. Tenkan-Sen is also called the conversion line. This line represents the average value of the price maximum (High) and minimum (Low) readings over the past N candles. As a rule, the default setting is set at a 9-day period.

The 9-day Tenkan-Sen is almost similar to the 9-day Simple Moving Average (SMA), but it is less smooth. The peculiarity of Tenkan-Sen is that the line indicates whether there is a distinct trend: when the price is following a “flat” pattern, the indicator is flat as well.
However, when the Tenkan-Sen line is moving, it represents the price movement over the 9-day period, which distinguishes Ichimoku from the SMA indicator. The advantage of the Tenkan-Sen line is that it indicates the support/resistance levels and the trend direction at the same time. This factor increases the versatility of this indicator.
Kijun-Sen
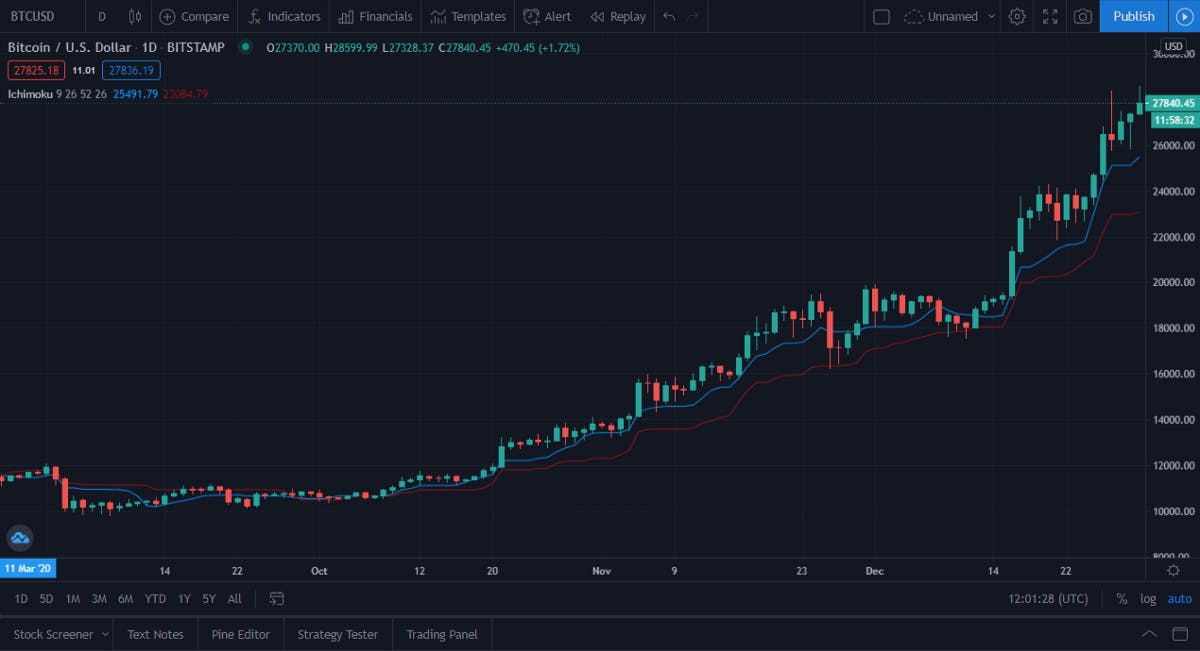
Kijun-Sen (marked red) is called the baseline. Similar to Tenkan-Sen, the baseline is calculated from the average value of lows and highs over the last period, the difference between them is that the period of Kijun-Sen is longer – 26 days.
Chikou Span
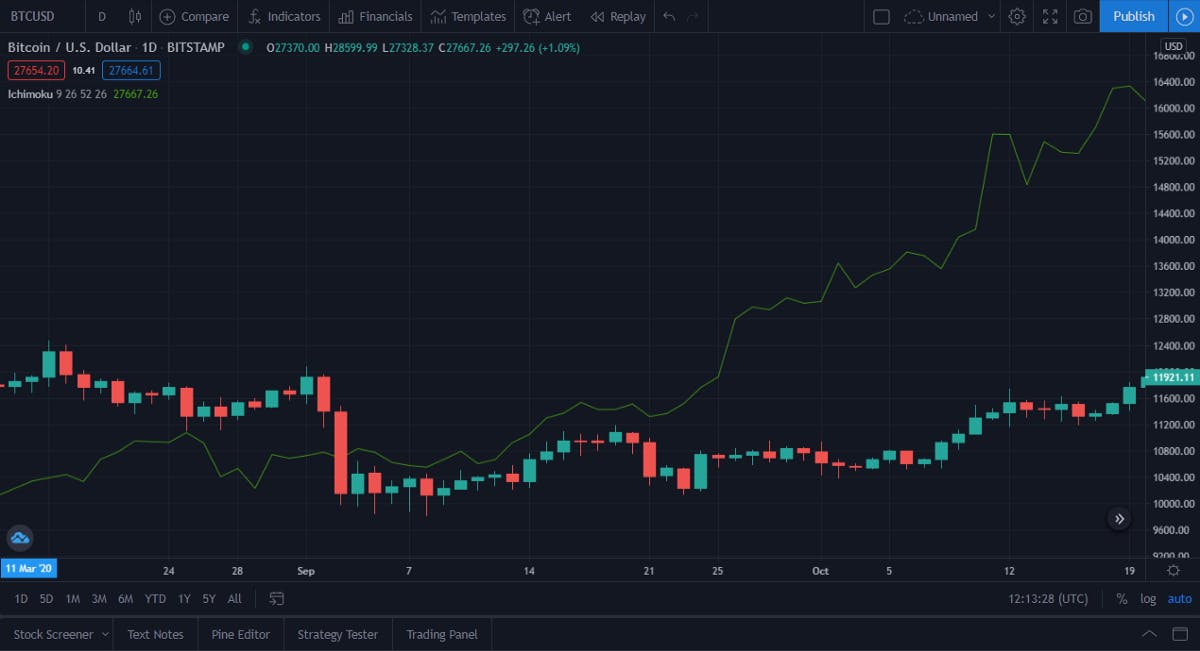
This is a line that displays the price with a specified lag. By default, the period is set to 52 days. Chikou Span indicates whether there is a distinct trend in the market. The Ichimoku cloud signals the direction of the trend when the Chikou Span moves in either direction.
Kumo
This cloud itself is the culmination of Ichimoku Kinko Hyo and the very “grail” that will make you a true samurai in crypto trading. Kumo determines the equilibrium between support and resistance while taking into account price dynamics during previous periods.
The longer the period of using it, the more accurate the buy and sell signals for your Ichimoku cloud strategy will be. The cloud is divided into large green and red zones, which indicate either an uptrend or a downtrend, respectively.
Kumo belongs to the so-called “leading indicators“. If you look at the chart, you will notice that the Ichimoku Cloud is far beyond the last candle.
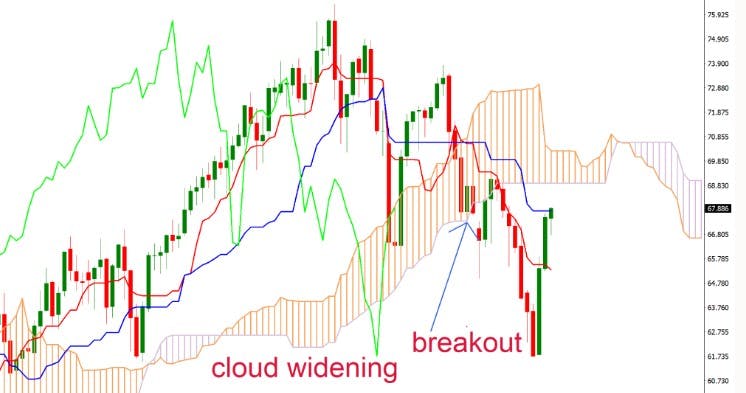
Surprisingly, the most important thing is neither the color of the cloud nor the direction of the price, but the area where the movement is taking place. Traders will avoid assets when their price oscillates within a cloud.
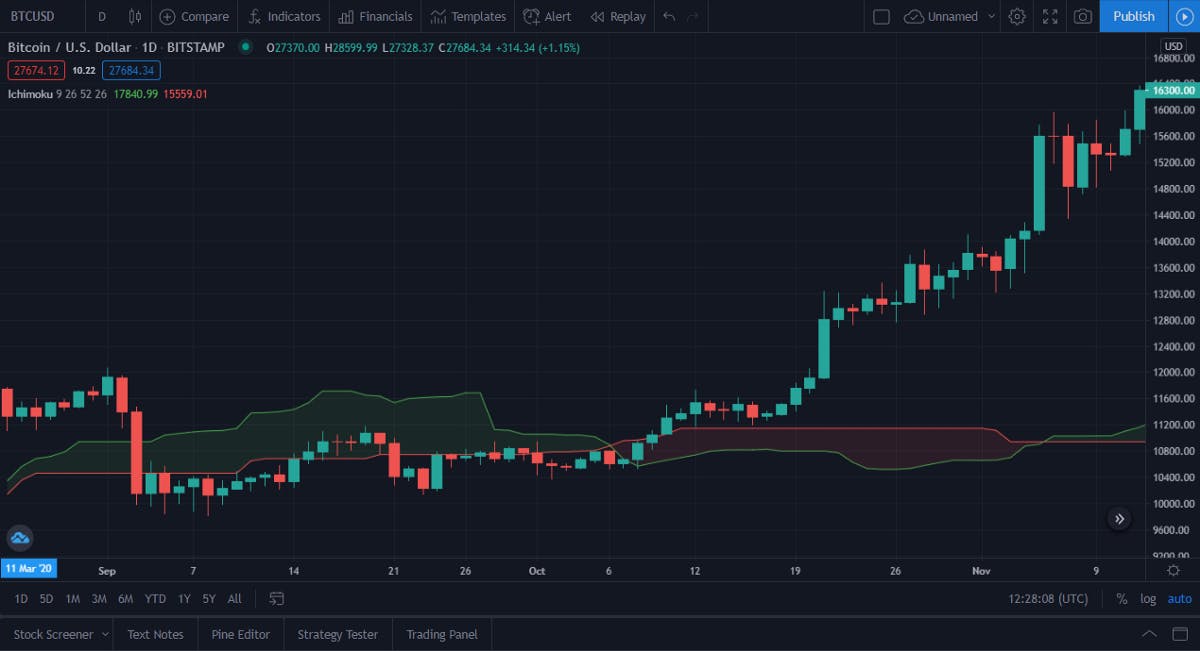
Notice that when the price action was in the cloud, there was no clear trend on the Bitcoin chart. But as soon as the price moved outside the Kumo, a strong trend emerged – this is what makes the Ichimoku cloud strategy one of the best trading strategies.
Ichimoku Cloud Trading Strategies
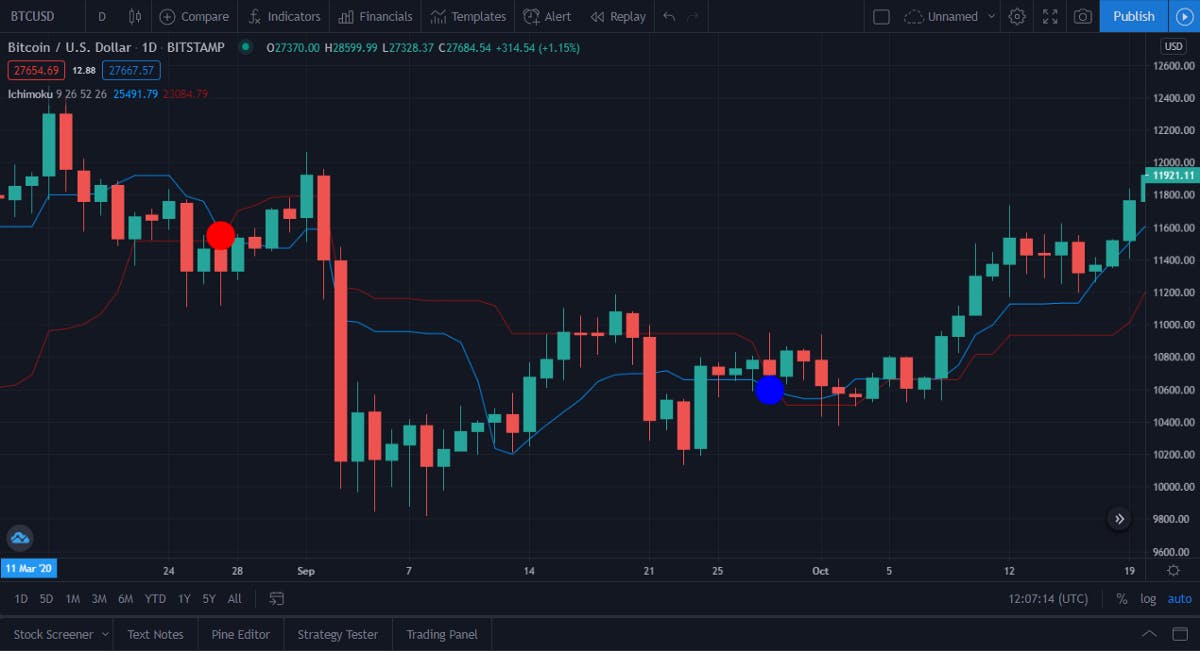
One of the first popular trading strategies among traders is to act on the conversion line (Tenkan-Sen) crossing the baseline (Kijun-Sen), similar to the moving average (MA) cross.
How the Ichimoku Cloud Strategy Works
Each of the components of the indicator plays a key role in Ichimoku cloud trading.
When the Tenkan-Sen (blue line) crosses the Kijun-Sen (red line) upwards, traders open a long position (Long). If, on the contrary, the blue line goes below the red line, we can expect a reversal and a price drop, which implies a sell signal. Examples are illustrated below:
Though the strategies using several components are more fundamental, practice calls to test different options to see what works best.
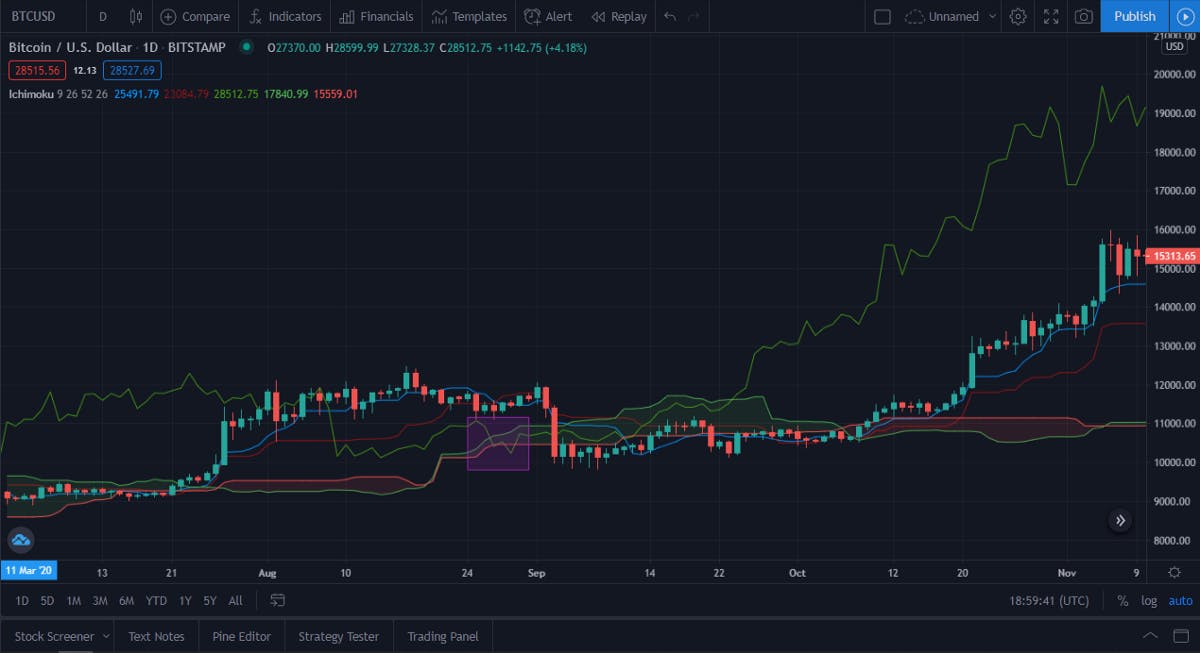
It is enough for a trader to look at the Ichimoku indicator to understand the potential price movement. That’s why the indicator is considered to be universal. The most reliable buy signals appear when the lagging Chikou Span line breaks above the Kumo cloud.
The reversal pattern indicates that a bearish sentiment prevails in the market. Let’s have a look at the chart:

The green line breaking through the blue one in a downward direction is a signal to stop trading. This is the moment when you need to consider several strategies and trade signals.
Traders take price movements above or below a cloud similarly. Such movements can indicate either an uptrend or a downtrend.
We will shed more light on how you can execute Ichimoku cloud trading later in this article.
How to Trade with the Ichimoku Cloud Indicator
Here's how the Ichimoku Cloud's various components can be used in trading the Ichimoku cloud strategy:
The Cloud
A cryptocurrency is in an uptrend when the price is trading above the cloud and the cloud is in green territory. On the other hand, a cryptocurrency is in a downtrend when the price is trading below the cloud and the cloud is in red territory.
People who follow trends and use this indicator will usually think about long trades when it shows an uptrend, and short trades when it shows a downtrend.
The cloud also represents the degree of volatility. A thicker cloud will result from large price movements, while a thinner cloud will result from a period of consolidation.
Chikou Span
Another component used for trading the Ichimoku cloud strategy is chikou span.
The Chikou Span is used by some traders as an additional confirmation of the trend. The line crossing the price in the bottom-up direction can be seen as a buy signal, while the line crossing the price from the top-down may be seen as a sell signal).
Senkou Span
Traders look to the top line for support if the price is above the Senkou Span, then they look to the bottom line for support.
If the price is below the Senkou Span, traders look to the bottom line for the first level of resistance and the top line for the second.
Tenkan/ Kijun Crossover
The tenkan/ kijun crossover is an important occurrence in Ichimoku cloud trading.
When a crossover occurs, some traders use the Tenkan/ Kijun cross for additional confirmation or even trade signals.
Ichimoku Cloud Day Trading
Day trading is one of the trading strategies that the Ichimoku cloud strategy is suitable for.
Trading cryptocurrencies involves buying a cryptocurrency and selling it for a profit. You can divide your trading into long-term and short-term strategies depending on your goals and how long you want to keep your cryptocurrency.
Day trading entails holding your cryptocurrency for brief periods ranging from a few minutes to a few hours. The goal is to sell your cryptocurrency before the end of the day and profit in a small but quick way.
The Ichimoku cloud day trading is an excellent Ichimoku cloud strategy for day trading cryptocurrencies. The edge-to-edge cloud setup is the most effective Ichimoku cloud day trading strategy. According to the strategy, when a candlestick closes in the Ichimoku cloud, the price moves to the other side of the Kumo.
When a candlestick forms below the Kumo cloud and then closes above the leading span A, an Ichimoku buy signal occurs. A sell signal appears when a candlestick forms above the Kumo cloud and then breaks and closes below the leading span A.
If you are using the Ichimoku cloud day trading strategy for day trading cryptocurrencies, you will have enough edge-to-edge trade signals to assist you in meeting your profit objectives. However, you can filter out false signals by using the other elements offered by the indicator.
How to Swing Trade Using Ichimoku Cloud
Swing trading with the Ichimoku Cloud works extremely well when the Kumo twist trade signal is used. Note that the Kumo cloud is the leading element of the Ichimoku indicator (projected 26 periods into the future).
The Kumo twist occurs when leading span A and leading span B cross. A bullish reversal occurs when Leading Span A crosses above Leading Span B while a bearish reversal occurs when Leading Span A crosses below Leading Span B.

The Buy Rules for Ichimoku Cloud Strategy
The Ichimoku cloud system helps traders stay on the right side of the market. The trading rules in this section will assist you in staying with the trend for as long as possible. The Ichimoku system is best suited to swing trading because it maximizes profits while minimizing risks.
The best Ichimoku Kinko Hyo time frame is the one that works best for you. We don't have a preferred timeline.
The steps below will show you how to ride the trend from the start. You will also discover how to maximize your profits.
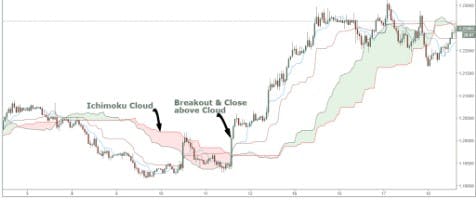
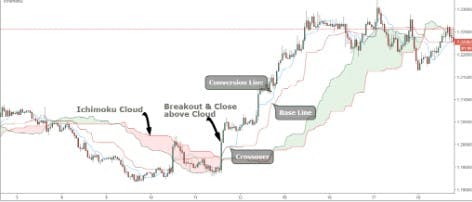
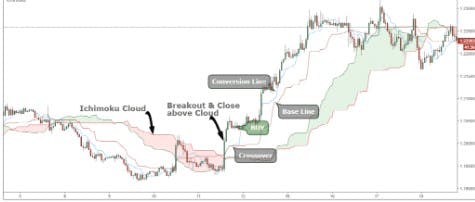
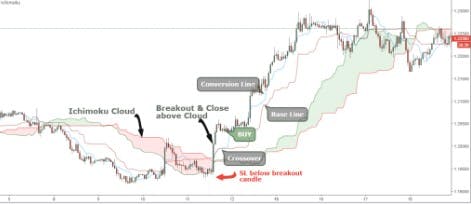
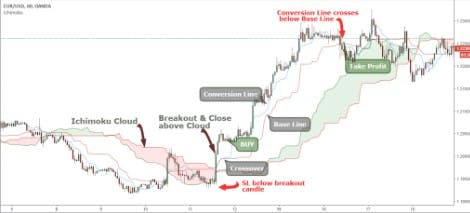
Step 1: Let the price break through and close above the Ichimoku cloud
To place a buy trade using the Ichimoku cloud, then the price must trade above the cloud. This signifies the start of a new uptrend.
The cloud is designed to highlight levels of support and resistance. Because support and resistance do not exist as a single line, they have several layers deep.
As a result, when we break above or below the Ichimoku Cloud, there is a significant shift in market sentiment.
Step 2: Wait for the conversion to cross above the base line
The price breakout above the cloud must be followed by the conversion line crossing above the base line. Once these two conditions are met, we can consider making a trade.
Step 3: Buy after the crossover at the next candle's opening
Any long trades using the Ichimoku strategy should ideally be entered when the price is trading above the cloud. As a result, following the crossover, we buy at the opening of the next candle.
Step 4: Place a protective stop-loss order beneath the breakout candle
Our protective stop loss should be placed below the breakout candle's low. This helps to accomplish two major goals.
It reduces the risk of large financial losses and also allows us to trade in line with the market's order flow.
Since this is a swing trading strategy, we want to profit as much as possible from this new trend. We'll look to trail our stop-loss level below the cloud or exit the position once a new crossover in the opposite direction occurs.
Step 5: Take profit when the conversion line falls below the base line
To take profit, we will wait for the conversion line to cross below the baseline. Alternatively, you can wait until the price falls below the cloud, but you risk losing some of your profits.
Pros and Cons of Ichimoku Cloud Strategy
Pros
Versatility
The indicator can be used to detect trends and determine their direction, support and resistance levels, and the intensity of price dynamics.
Simplicity
Ichimoku Cloud can be easily automated with 3commas.io bots. The indicator is very easy to use, whether you are a beginner or a professional trader.
Compatibility
The Ichimoku Cloud indicator is combined with other simple indicators such as MA, MACD, RSI, and others. A comprehensive approach will eliminate unnecessary noise in trading and increase the accuracy of trading signals.
Cons
Variety
For beginners, it may be easy to get confused at first in terms of reading the signals and what the components stand for. This can lead to trading mistakes.
Congestion
Too many lines can be confusing to inexperienced traders. However, this is an easy fix. If you are just getting acquainted with the indicator, you can try different strategies using the lines or the cloud exclusively. This way, you will gradually learn the principles of the indicator and test the strategies.
This article does not contain investment advice or recommendations. Every investment and trading move involves risk, and readers should conduct their own research when making a decision.