
“Buying low, selling high” is surprisingly difficult in real life. History tells us that rising companies often keep going up, making it hard to know when to take profits off the table.
It’s why an entire industry of technical analysis exists. Strategies like the Relative Strength Index (RSI) attempt to use historical price data to predict future movements. But does it work?
What Is the Relative Strength Index (RSI)?
The Relative Strength Index (RSI) is a contrarian technical analysis indicator that uses price movements to find “overbought” and “oversold” assets. The system was introduced by J. Welles Wilder Jr. in 1978 and has remained popular among swing traders since.
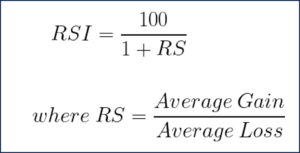
The RSI uses a straightforward formula to create an indicator that ranges from zero to 100.
Stocks and other assets are bought whenever the indicator drops below “30” and sold above “70.” The lower the RSI indicator, the more bullish investors should become.
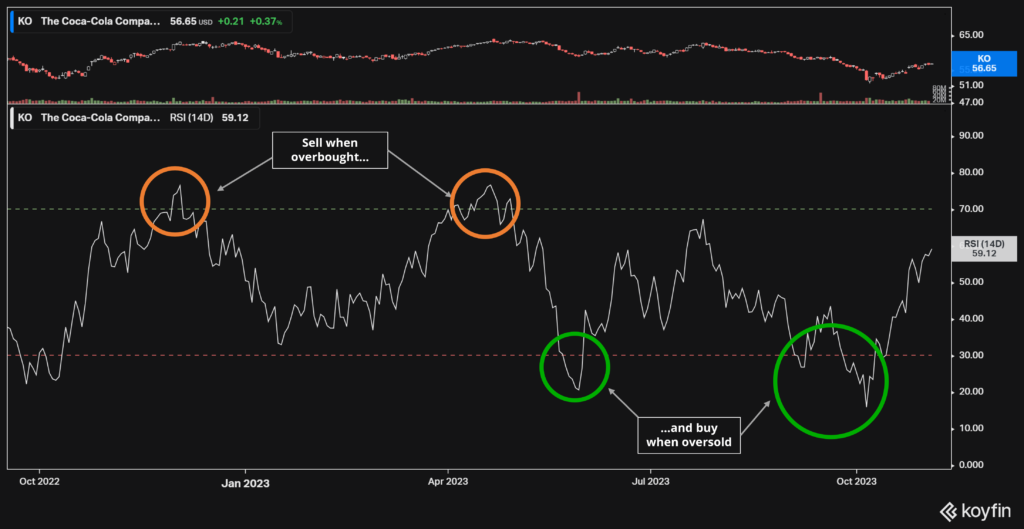
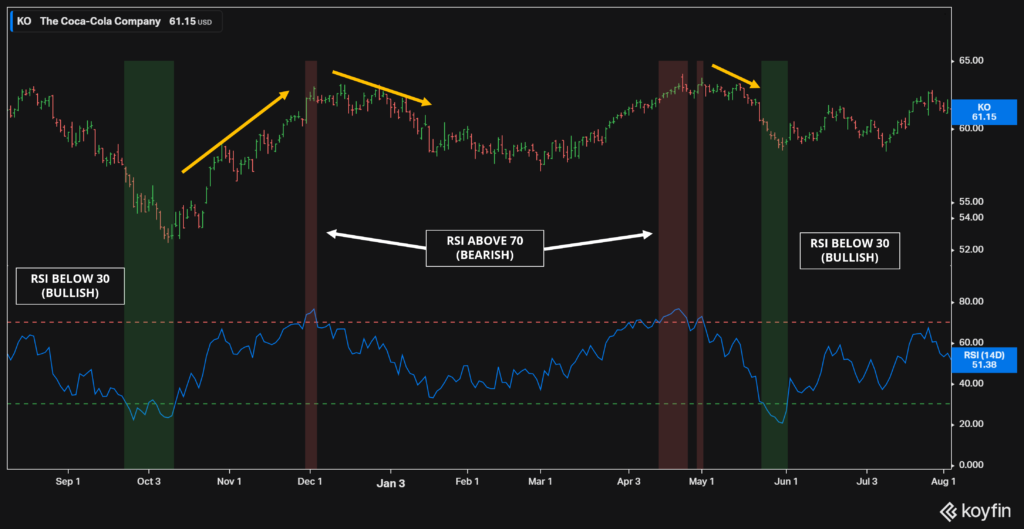
The system works… Or at least it seems to. Here’s the same graph for Coca-Cola (NYSE:KO) with its share prices expanded. You’ll notice that buys happen in local troughs and sales happen at peaks. It’s the classic “buy low, sell high” way of making money.
There are also different versions of the RSI. The standard index is calculated over a 14-day period, which is referred to as “RSI-14” or “RSI (14D)”. Longer ranges, such as 20 days and 50 days, can also be used. They’re notated as RSI-20 and RSI-50, respectively.
Few fundamental-driven investors, however, take the RSI seriously. Studies have shown that the indicator fails to perform in trending markets, which is the equivalent of saying, “I’m right all the time… Unless when I’m wrong.” Technical analysis also gets a relatively poor name for its lack of intellectual rigor. Why, for instance, should RSI indicators be calibrated on a 14-day cycle instead of a 13-day one? And as I’ve repeatedly noted, how many billionaires got rich from drawing lines across stock charts?
How to Calculate the Relative Strength Index
To calculate the Relative Strength Index, let’s assume we’re using a 14-day average. Calculating the first RSI-14 figure involves:
- Gains. Take the average value of the past 14 days of gains. Losses are ignored.
- Losses. Take the average loss from the past 14 days. Gains are ignored.
- Find RS. Divide the two numbers to get the Relative Strength (RS) figure. Higher numbers indicate greater strength since gains outweigh losses.
- Calculate RSI. Plug the RS value into the formula 100 / (1+RS) to output your RSI value.
Subsequent RS figures are calculated by:
- Gains. [(Previous Average Gain) x 13 + Current Gain] / 14.
- Losses. [(Previous Average Loss) x 13 + Current Loss] / 14.
Using Python to Calculate the Relative Strength Index
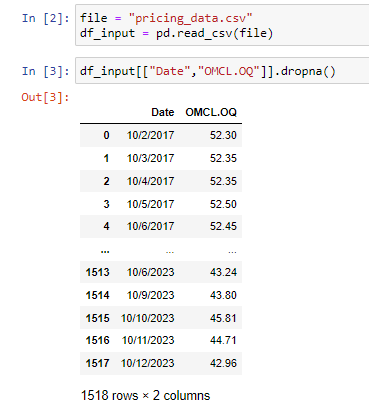
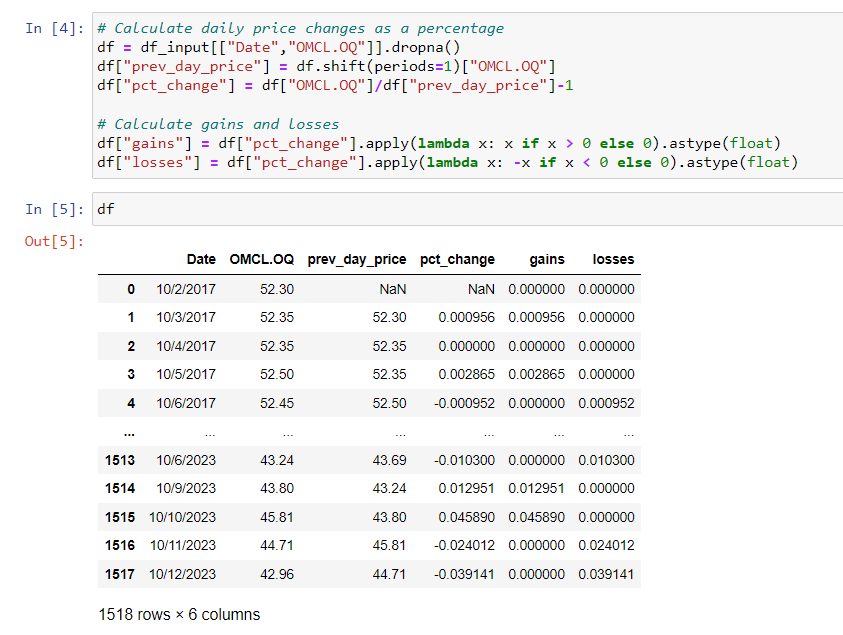
To test the performance of the Relative Strength Index, it’s possible to code the strategy by hand. Here, let’s assume we have a Python dictionary of stock prices — in this case, the values of Omnicell (NASDAQ:OMCL) between 2017 and 2023.
We’ll then calculate the daily percentage price change by creating a new column called “prev_day_price” and comparing it to present-day prices to get a “pct_change” column. Gains and losses are tallied with a lambda function. (Note that we fill the “gains” column with zeros on negative days and the “losses” column with zeros on positive days.)
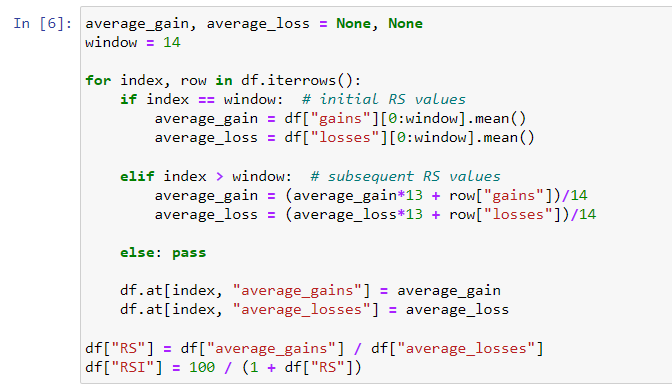
Our next step is to calculate RSI values over time. Here, we’ll use a for-loop since next-day RSI values depend on previous-day figures. Finding RS and RSI values then uses straightforward formulas.
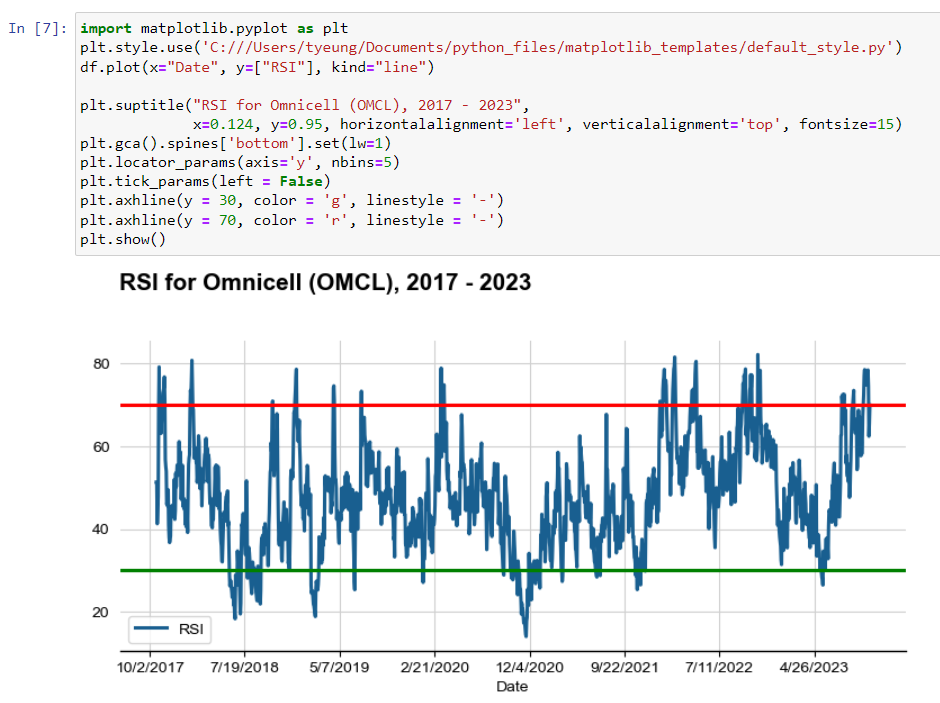
Once we have our RSI for Omnicell, we can put it into a Matplotlib chart. Here’s what it looks like, with the RSI indicator creating plenty of buy/sell signals over time.
As for the performance, here’s what would have happened if we bought whenever shares of Omnicell hit “30” and sold at “70.” (Notice that we’re shifting to logarithmic returns because it’s more accurate than algebraic returns. We’re also using next-day returns to make our performance more realistic.)

The results look decent. $10,000 invested in Omnicell would have turned into $12,560 over five years, compared to $8,214 with a buy-and-hold strategy. Had we achieved the close price of each day rather than a “T+1” price, our return would have been even higher at $27,233.
Things look even better if shorting is allowed. To find this, we change one line of code to permit negative positions and rerun.
df.loc[(df['RSI'] > 70) & (df['prev_RSI'] <= 70), "position"] = 0
df.loc[(df['RSI'] > 70) & (df['prev_RSI'] <= 70), "position"] = -1

Our return increases to $17,537 if we allow shorting and use T+1 trading prices…
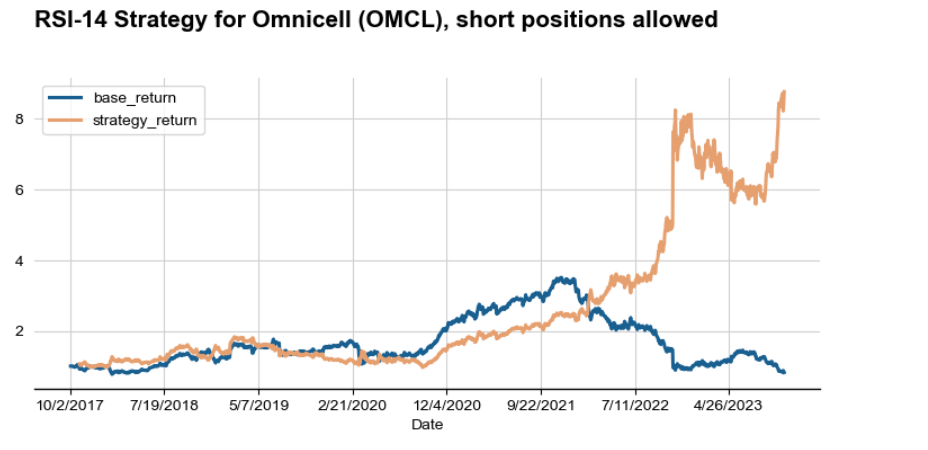
…And jumps to $87,704 if we manage to get day-of pricing. That’s roughly 10 times better than a buy-and-hold strategy! (These inter-day figures also show the importance of day trading when buying on 14-day momentum.
Does the RSI Index Work on Stocks?
Of course, Omnicell’s outperformance could be a fluke. One positive finding doesn’t mean RSI works every time, and even Omnicell saw several years of underperformance before breaking out in 2022.
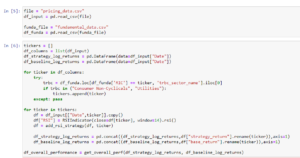
To test this, we can run the RSI-14 indicator on every Russell 3000 stock since 2018 and average the results. (The index includes the 3000 largest U.S.-listed firms, which covers around 98% of total market value.) Here, I use a large dataset collected from Refinitiv, a Thomson Reuters service that covers current and defunct companies. Including bankrupt and merged firms reduces survivorship bias and gives us a better idea of how a strategy would have performed without knowing which companies would survive and which would fold.
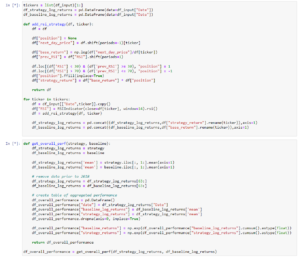
To streamline our code, I’ll use TA Python, a pre-made package, to calculate RSI values. I’ll also convert our strategy into a reusable function called “add_rsi_strategy” and add a data aggregation function called “get_overall_perf” to average returns across all 3000 members of the Russell 3000. This allows us to reuse the same code to test multiple strategies.
The Results
The returns are positive across the Russell 3000. $10,000 invested in the broad-based index rebalanced daily would have grown to $11,055, compared to $7,400 in a buy-and-hold strategy. This assumes we bought any stock when it crossed above the “30” mark and shorted them at the “70” level.
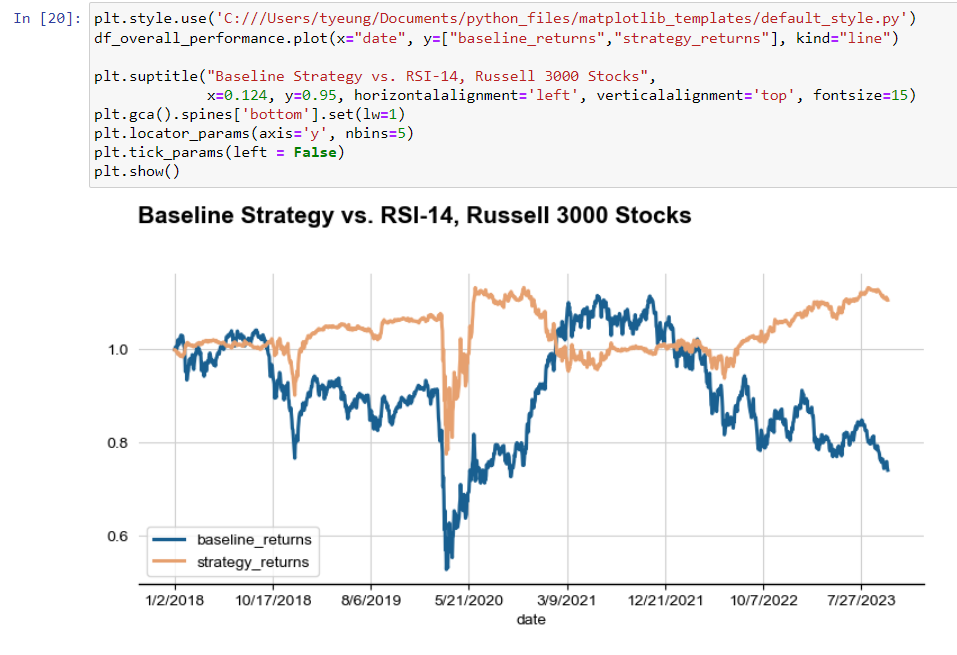
Even without allowing short positions, our return beats the index by a healthy 36%.
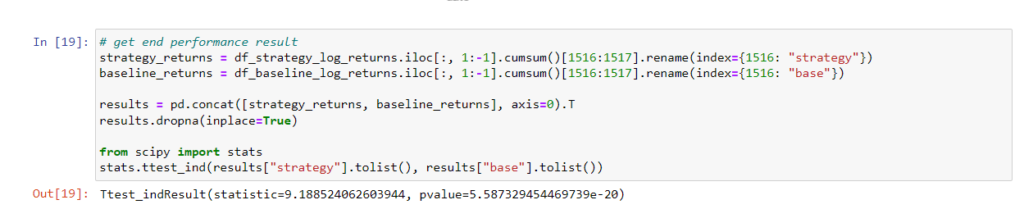
We can also perform a t-test on these results to make sure this wasn’t all luck. Below, I select an end date of “1516” (i.e., Oct 12, 2023) and compare whether the cumulative returns are positively different. The output from the statistical package SciPy shows they are significant at the 99% confidence level (i.e., we can be 99% sure our outperformance was genuine).
Turning the Relative Strength Indicator Into a Profit Spinner
Until now, we’ve used the RSI indicator without considering company fundamentals. The result is that we’re scrounging for returns. Turning $10,000 into $12,560 over five years isn’t exactly the most compelling strategy.
So, how can we do better?
Regular readers will know that adding fundamental data to technical analysis can go a long way, especially if you understand the nature of your system. It’s the equivalent of using the right tool for the job.
In the case of RSI, we know the strategy is a “mean-reversion” type, where stocks are bought at bottom-of-cycle moments and sold at the top. Mathematically, stocks only reach the “oversold” signal of 30 when losses significantly outweigh gains. That means RSI will outperform when stocks wobble around a central value and underperform when they break out of that range.
So, let’s try re-running the RSI strategy on mean-reverting stocks — in this case, consumer non-cyclicals and utilities. These are firms like Procter and Gamble (NYSE:PG) and American Water Works (NYSE:AWK), where earnings tend to gravitate around a central value.
Now, we start getting some interesting performance:
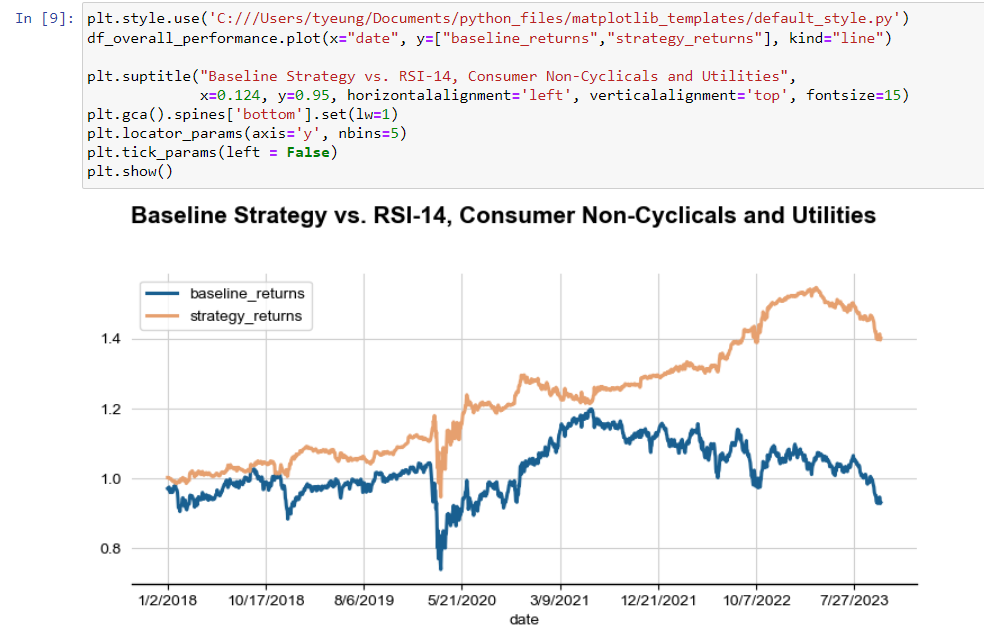
Here, we see the RSI trading strategy outperforming by an enormous margin! An investor following the strategy would have been net-positive in every period starting in 2018 and turned $10,000 into $14,000 (using our conservative T+1 pricing method). It’s a stunning result for a risk-reduction strategy.
The RSI-14 strategy is also valuable in helping us avoid high-risk companies. That’s because the most volatile firms will often rise quickly (triggering the “overbought” signal) and then slowly deflate as speculators realize their mistake. Meme stocks like GameStop (NYSE:GME) and AMC Entertainment (NYSE:AMC) fall into this category.
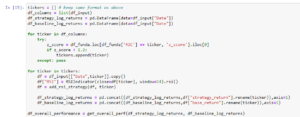
One measure of this type of risk is the Altman Z-score, a financial metric that combines working capital, retained earnings, operating performance and sales into a single figure. Any number under 1.81 is considered in the “distress zone.” Let’s take companies in extreme distress that score under 1.20.
Here, we see the RSI indicator excelling at helping us avoid significant underperformance. Our outcome is a stunning 71.7% return over five years, or roughly 11.4% annualized.
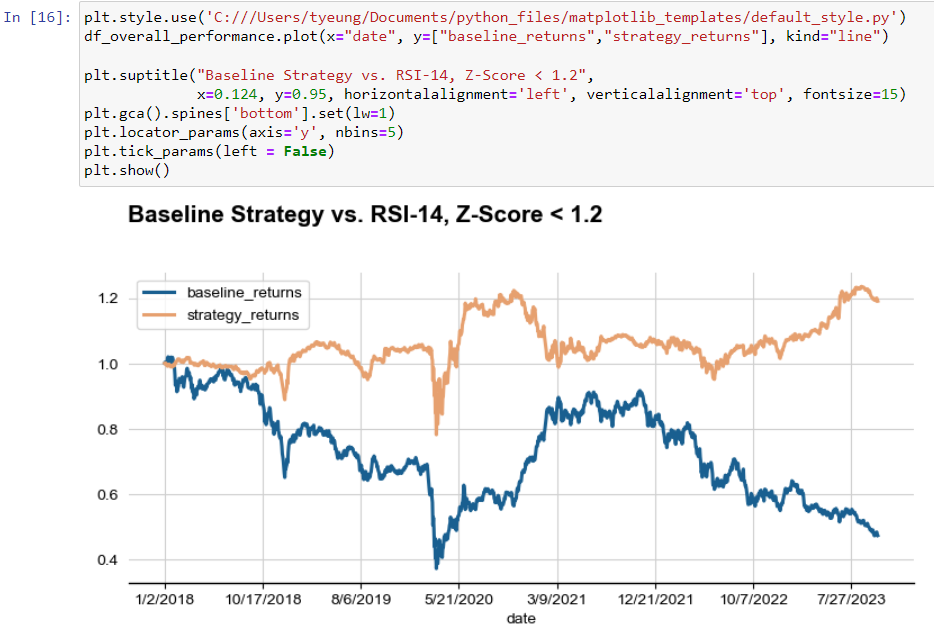
The effect is even more apparent among biotech firms, whose shares often see enormous price spikes during early successes, which causes the RSI indicator to trigger a short position. Shares then sink as the harsh realities of late-stage clinical trials kick in, rewarding investors with consistent returns. Only about 10% of biotech drugs submitted to the U.S. Food and Drug Administration (FDA) ever make it to approval.
Reverse-RSI Strategies
On the other hand, “breakout” stocks need the opposite strategy, where high prices are rewarded and low prices are penalized. Put another way: We need to modify our RSI strategy when we face situations where winners keep going up.
The most straightforward modification is to run our RSI strategy in reverse. We buy whenever the indicator tells us to sell and sell when it tells us to buy. (Anyone with a 2-year-old will know the game of opposite day.) We can do this by reversing the “1” and “-1” position sizes in our trading algorithm.
    df.loc[(df['RSI'] < 30) & (df['prev_RSI'] >= 30), "position"] = -1
    df.loc[(df['RSI'] > 70) & (df['prev_RSI'] <= 70), "position"] = 1
The strategy works surprisingly well. Here’s a graph of the “reverse-RSI” strategy on companies that paid no dividends in 2017. I selected this group knowing that zero-dividend stocks tend to either be 1) startups with no cashflow to distribute or 2) dying companies that can’t afford payouts.
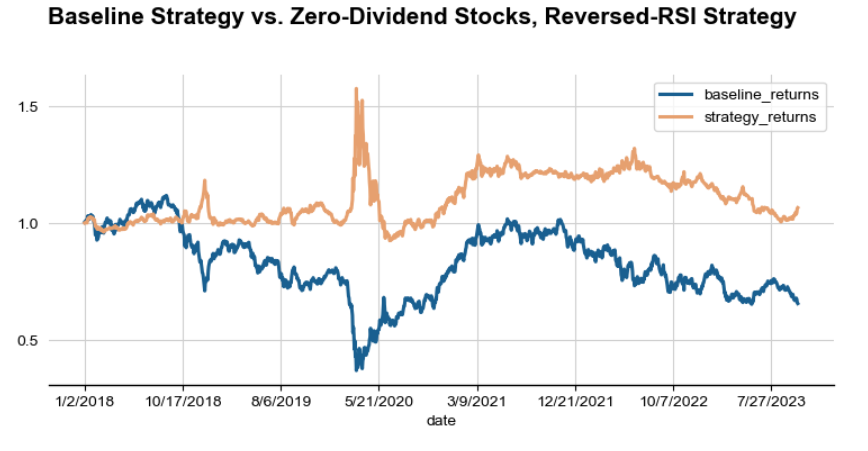
Here, $10,000 grows to $10,688 rather than shrinking to $6,564.
We can tune things to be even better. Here is the same group of zero-dividend stocks with two additional criteria to screen for “breakout” potential:
- Stock Issuance. The company raised money from public markets in 2017.
- Growth. Analysts expected the firm to increase sales by 20% or more the following year.
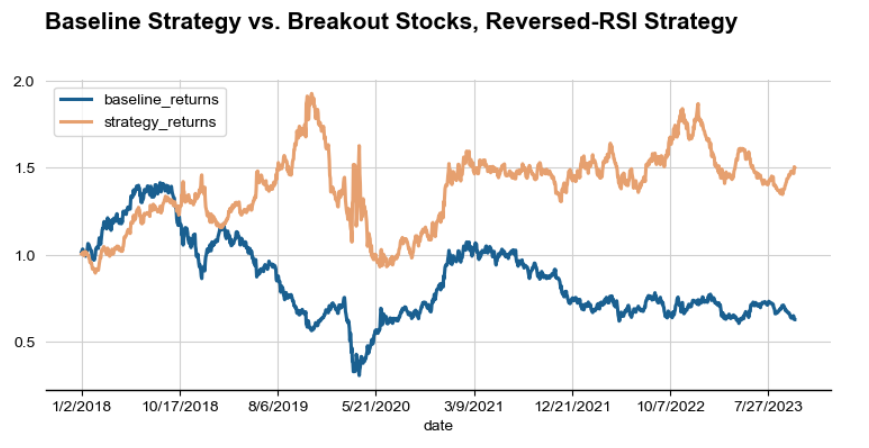
The performance is excellent, as we would expect. $10,000 invested using the “reverse-RSI” strategy on breakout stocks would have risen 50.2% to $15,020 over five years, compared to a 47.1% decline if we had used a buy-and-hold strategy. The figures are even better if we update the fundamental data over time. (Our initial tests only used information from the end of 2017.)
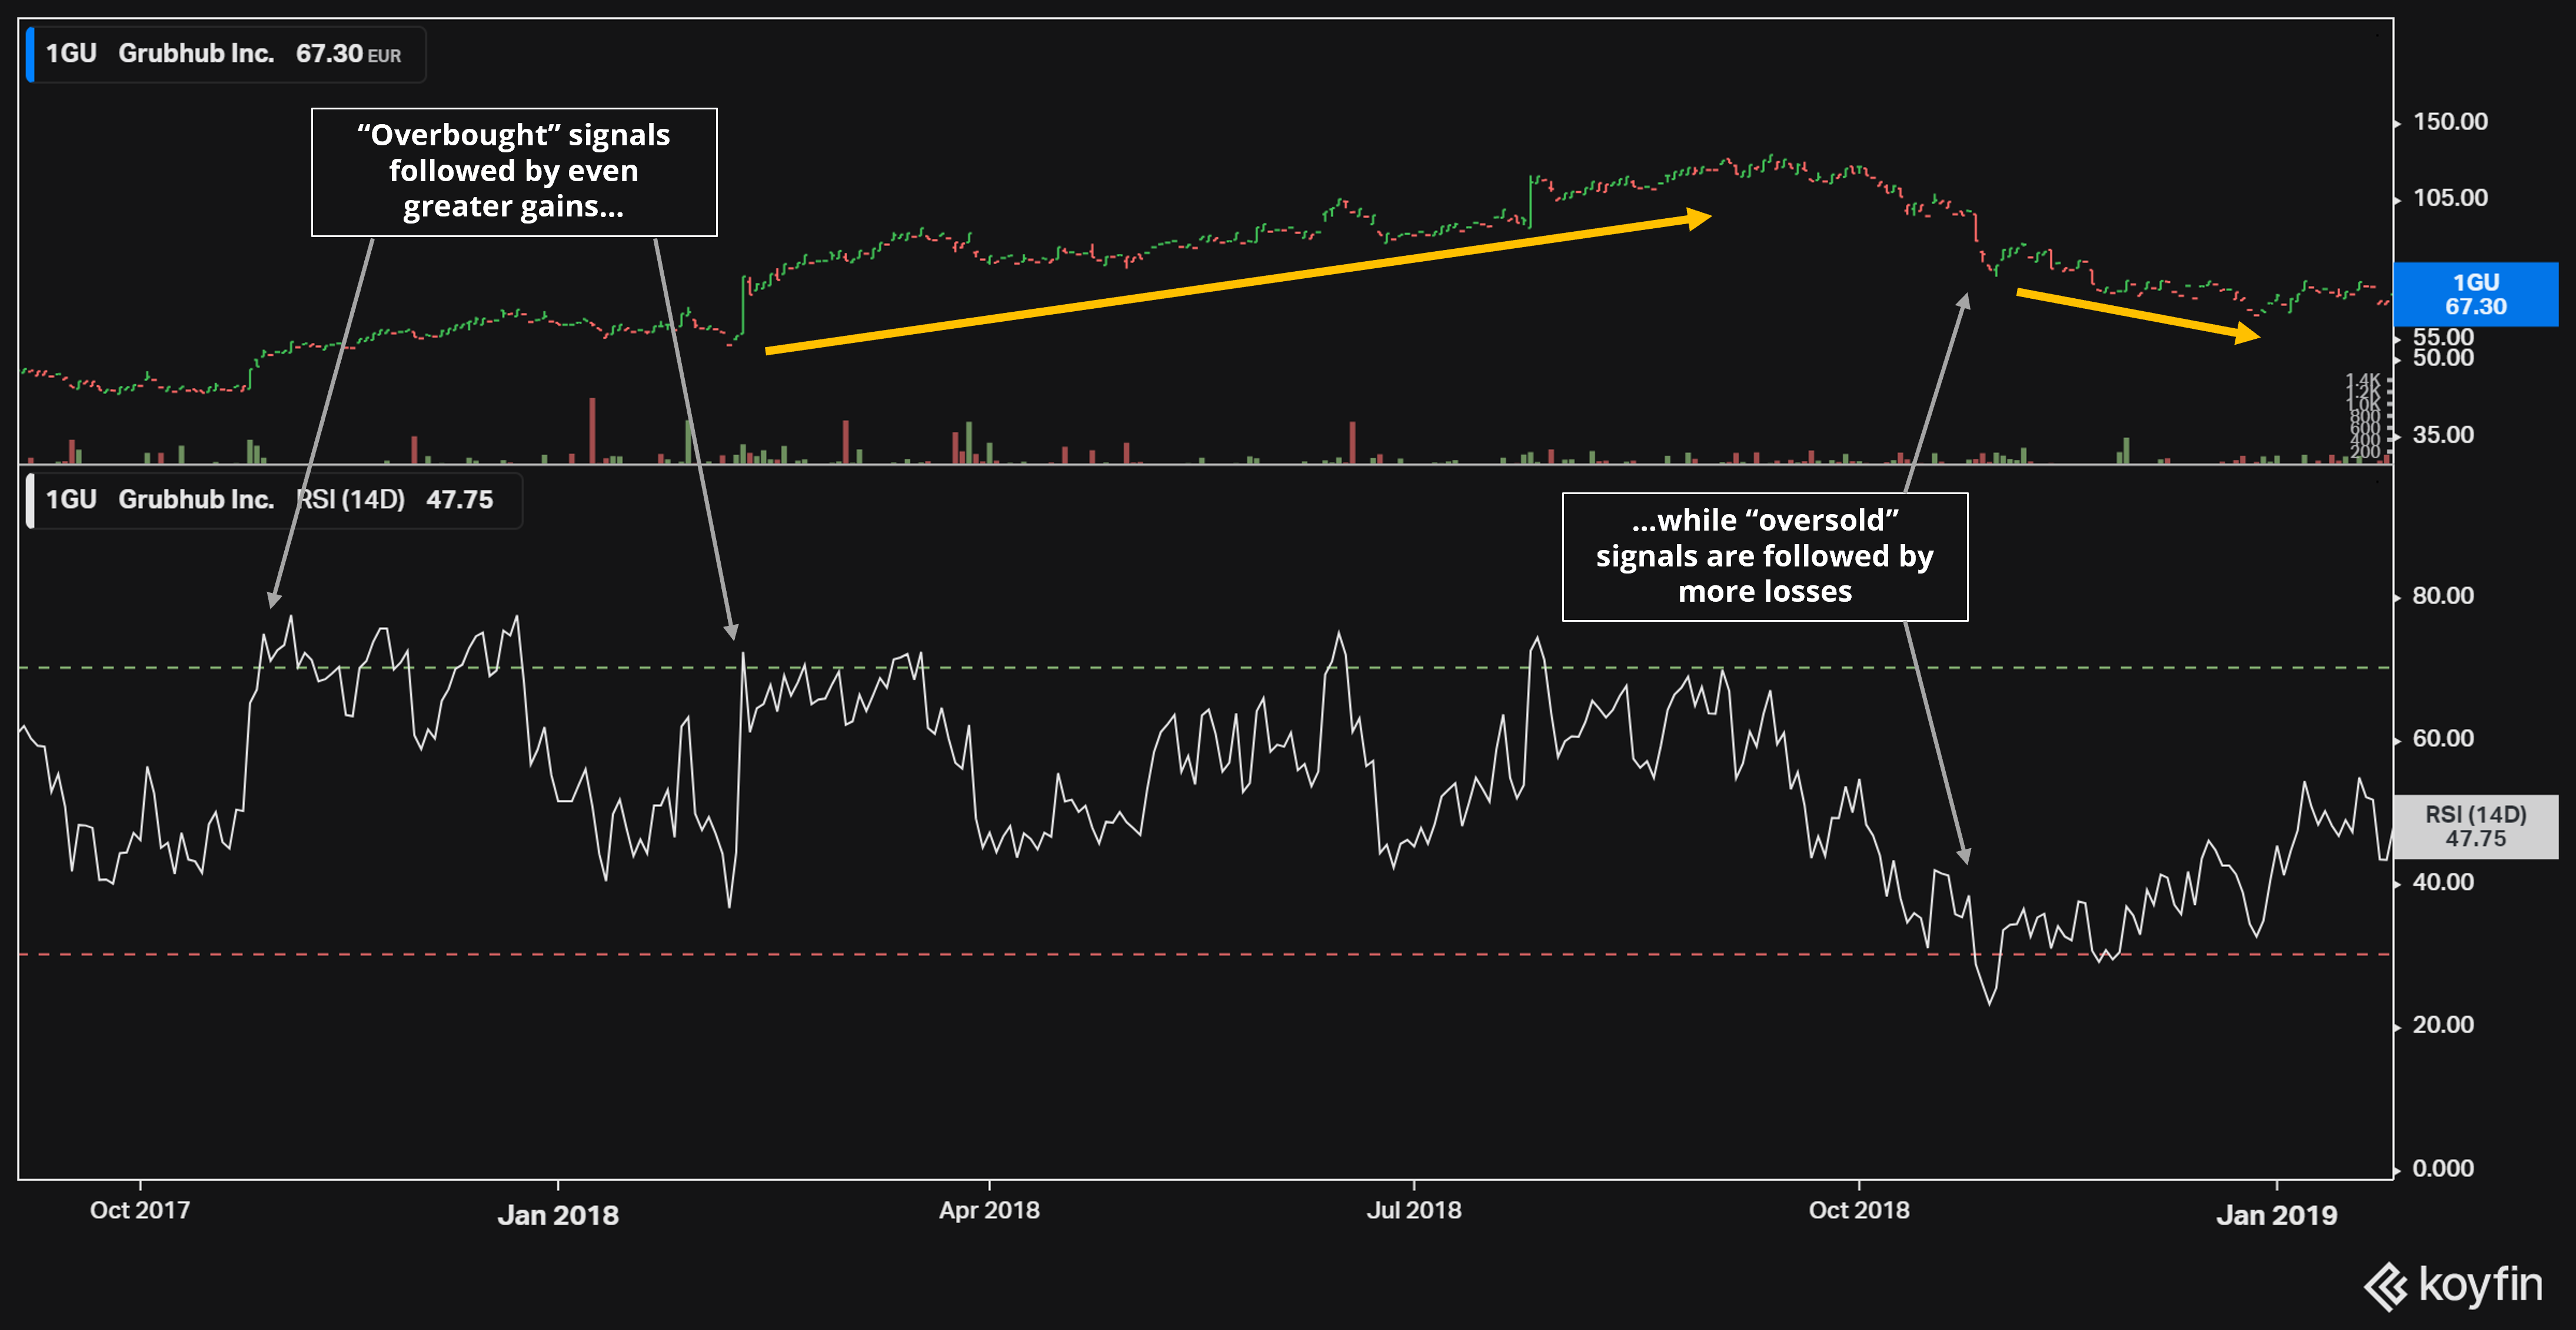
Consider Grubhub, a high-growth company that lands on our 2018 list of “breakout” stocks. In its short history as a public company, the meal delivery firm would reward momentum-seeking investors by hitting the overbought RSI level of 70 and then keep going up. Then, when prices started to deflate, the opposite would happen. The company would eventually lose 80% of its peak value and get bought out by rival Just Eat Takeaway.com (OTCMKTS:JTKWY). It’s why we must be so careful to apply the right RSI strategy to the right stocks.
Understanding the RSI indicator: how to read RSI?
The Relative Strength Indicator explained. What is RSI in crypto? And most importantly how to read RSI crypto? Reading the RSI requires some practice, and we hope that this article will guide you. Like most indicators, the RSI can give many false alarms, and it’s very important to identify the really important bullish or bearish indications. For RSI trading to be successful, you want to combine its signals with other indicators to eventually get the highest probability of being correct. Once you have learned the RSI in crypto, you can apply it to any other market.
Did you know?
The word bullish indicates that buying is stronger than selling, and the market sentiment is positive.
The word bearish indicates that selling is stronger than buying, and the market sentiment is negative.
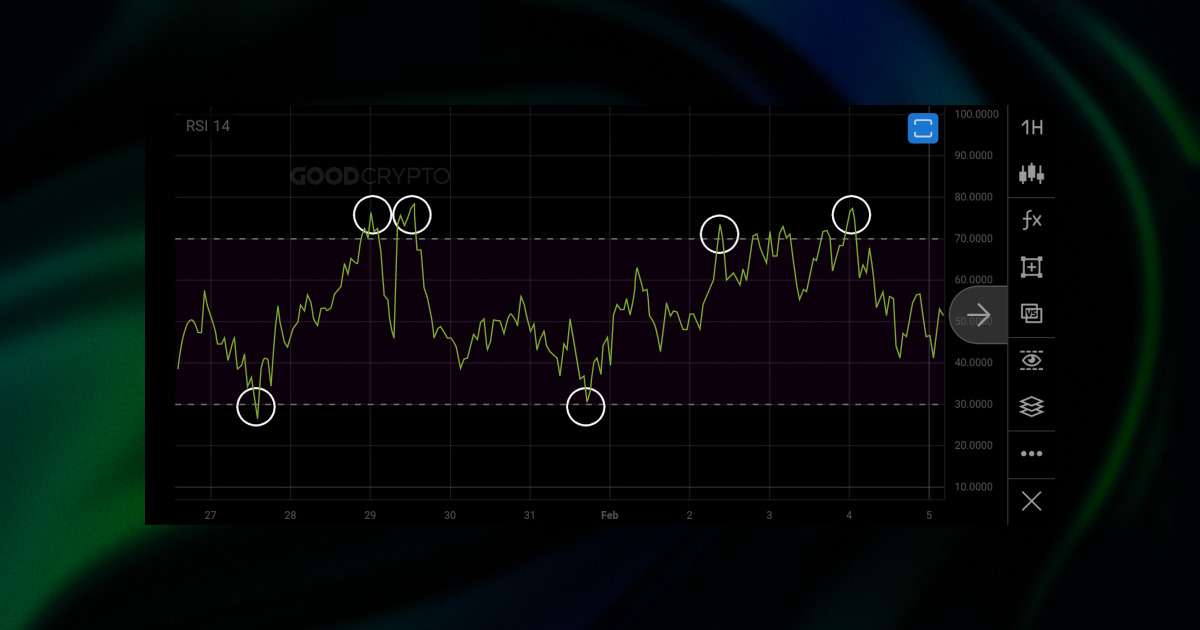
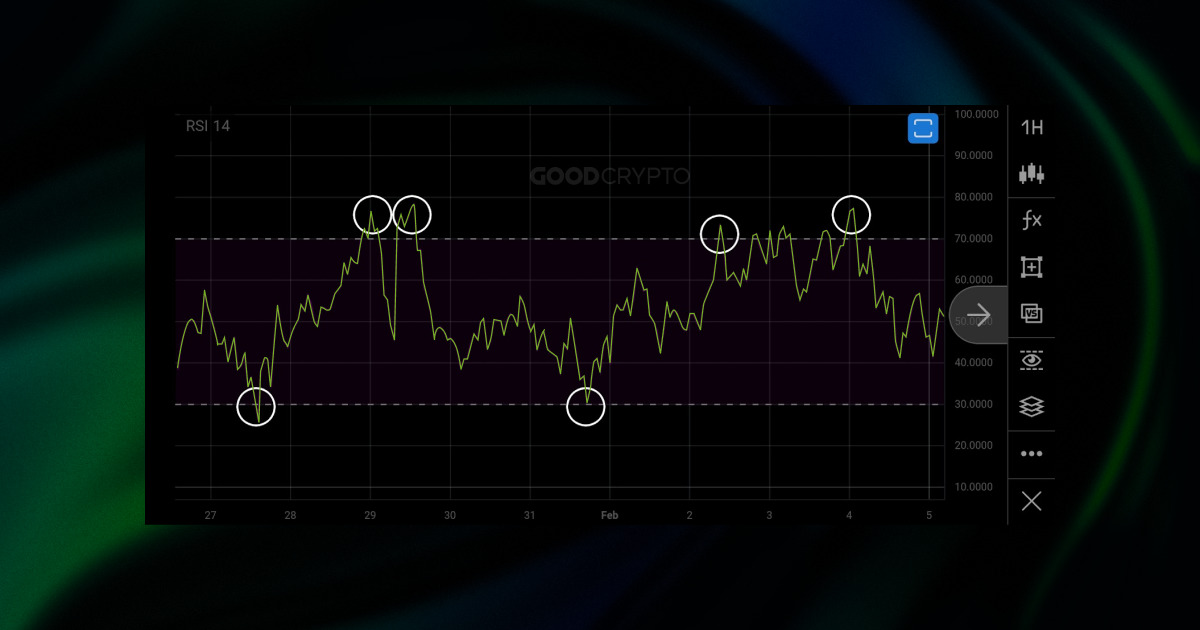
BTC/USDT 1H – the RSI indicator. The best RSI settings for 1 hour chart are the standard settings, and fit for any timeframe.
Overbought versus oversold
When looking at the RSI indicator, you can see a bar or a band, indicating the zone between values 30 and 70. Overbought signals are given when the indicator rises above 70 RSI level, and oversold signals are given when the indicator drops below 30 RSI level.
Simple!
Wait, but, if it’s so simple…
Ok, it’s not SO simple. Let’s dive deeper.
When a market is trending, the sentiment goes beyond indicators. What does this mean? In theory, a market can be overbought for a long time, and also it can be oversold for a long time. There is no certainty that the market has reached its peak or bottom by simply looking at the RSI indicator while trading crypto.
When can we trust the RSI indicator?
Mostly, signals will be more valuable when you see the price ranging. Ranging means that the price is going up and down in a certain zone, creating resistance above and support below. When price action is in a range, it is also said that the market is going sideways. There’s simply no significant moves upwards or downwards, no continuation.
When the price is trending, which means it is creating new highs or new lows, the RSI is less reliable. Why? Because, when the market is making new highs, we cannot predict with the RSI where it will stop. And likewise, when the market is making new lows, we cannot predict how low the market will eventually go.
RSI for crypto is likely the most used indicator besides moving averages, but it works on any kind of chart, including stocks.
To conclude: when a market is in a range, you can use the RSI crypto indicator to buy low and sell high.
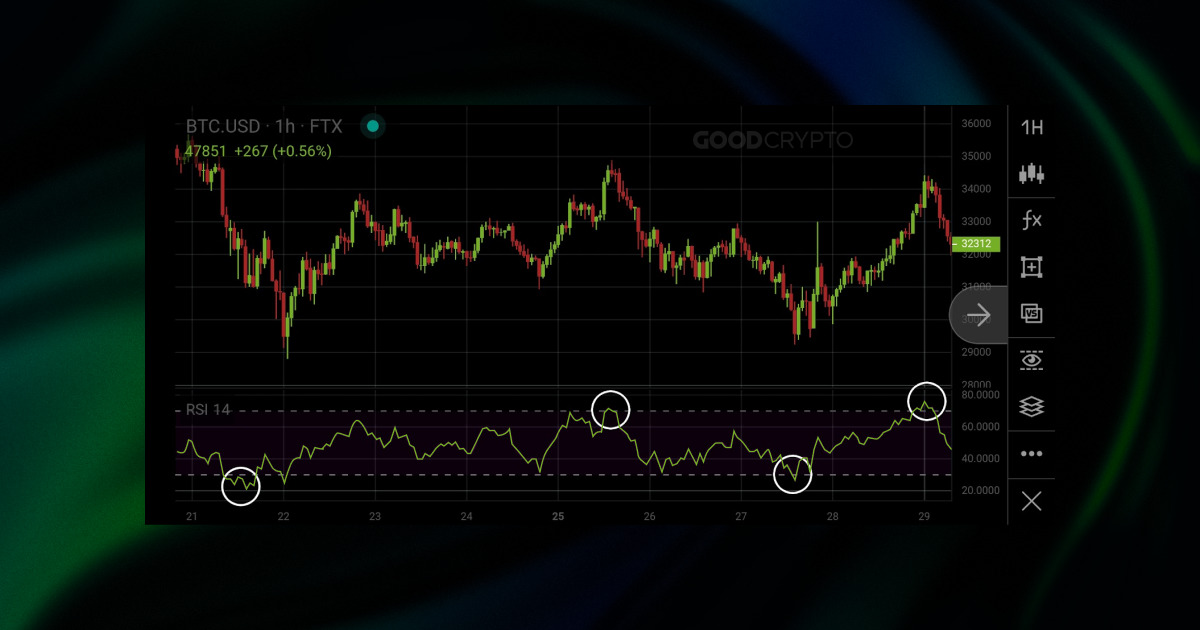
In this example, we can see the RSI aligns with the price action, giving you buy and sell signals. A typical chart where the price goes “sideways” or simply ranges. This is the perfect moment to interpret RSI overbought and oversold signals as buy and sell signals.
Convergence and divergence of price and RSI
This is one of the most important RSI crypto signals that the RSI indicator can give you. Some traders are always on the lookout for divergences. What makes this signal so strong, and how do you see it?
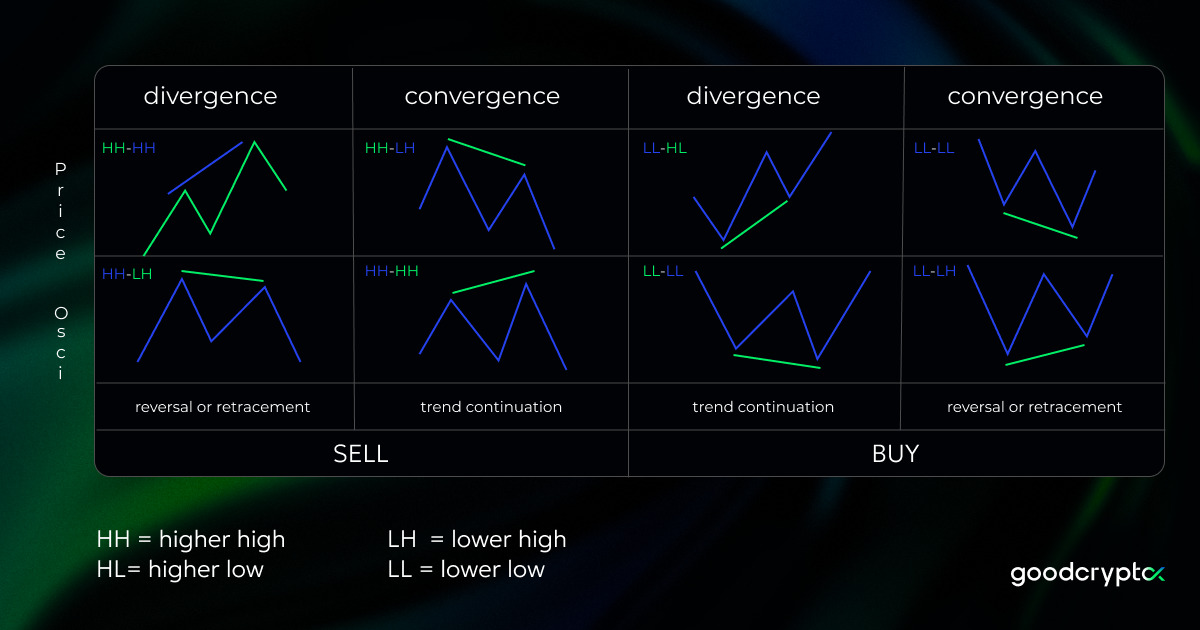
Let’s have a look at the cheat-sheet we made for you.
HH = higher high
HL = higher low
LH = lower high
LL = lower low
What is divergence or convergence?
The RSI convergence and divergence definition: Convergence and divergence reflects the directional movement of the market price and the RSI oscillator. When price and RSI move in the similar direction, they are converging, and when they move in opposite directions they are diverging.
-
RSI Divergence is when the price makes a higher high or a higher low, and the oscillator makes a lower high or a lower low in the meantime.
-
RSI Convergence is when the price makes a lower high or a lower low, and the oscillator makes a higher high or a higher low in the meantime.
What makes convergence and divergence so strong?
Imagine the market is making a peak. After a little retracement, the price makes a new high yet again, but the RSI is showing less strength, which would mean fewer people are willing to buy the asset at a higher price and so it is more likely to go down.
It might be even easier to understand it when explained in another way. Imagine on a physical market someone is selling apples, and the salesman is raising the price. But the higher the price goes, the fewer people are willing to buy. As a result, the salesman will need to lower the price of the apples to find new buyers.
Technical analysis is exactly this, looking for indications that the price will change, and you make a calculated bet on the expected change. However, it’s not an exact science, and you should know that these indications can always turn out to be false.
Ideally, you find as many indications as possible to strengthen your opinion. For example, when trading with the RSI indicator it’s most ideal to find divergence exactly when the RSI is below 30. By combining these indications, you can get more confirmation that there is a possible reversal in price.
Seeing these high and lows is the key to identify divergence or convergence. Let’s take a look at the RSI Bitcoin chart below.
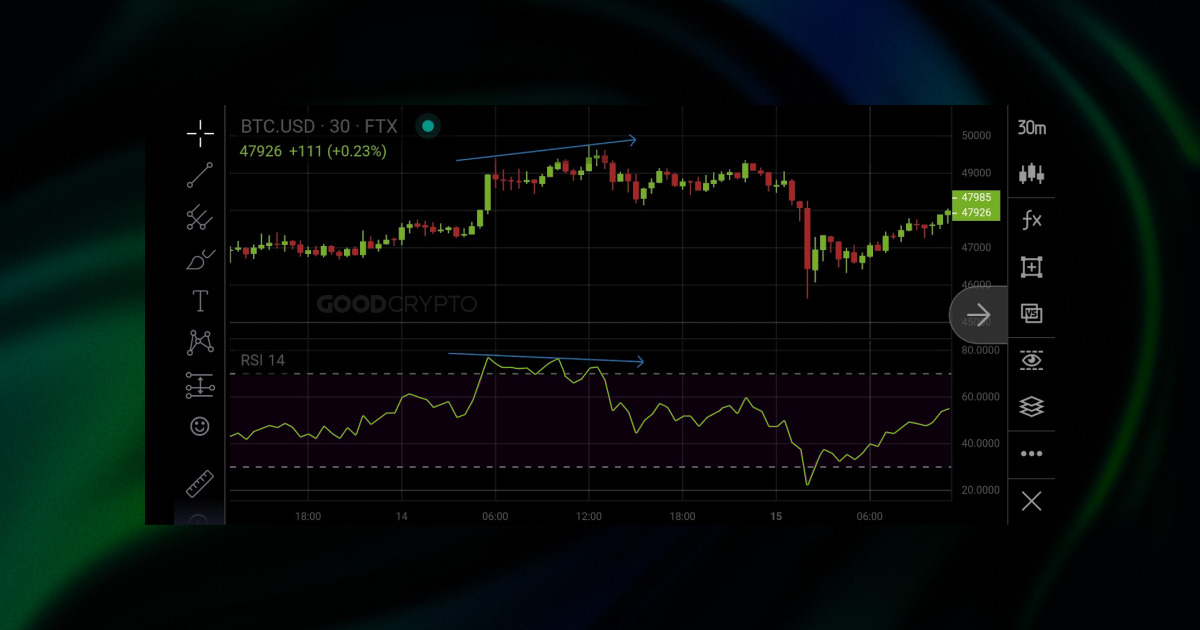
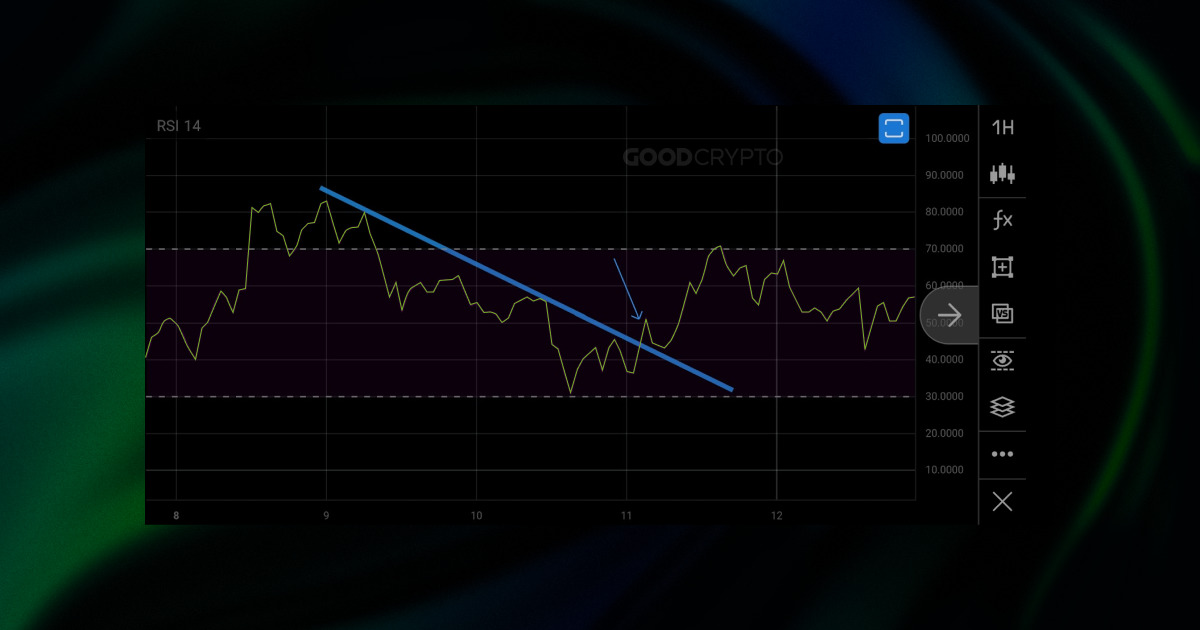
Bearish divergence, price makes HH and RSI makes LH.
An example of “bearish divergence”, when the price makes higher highs but the RSI is overbought and shows lower highs.
In the chart we can see the price making a higher high (marked by the blue arrow), while the RSI is making a lower high. Although the price traded sideways for a little longer, it eventually dumped as the buying power was too low to sustain it.
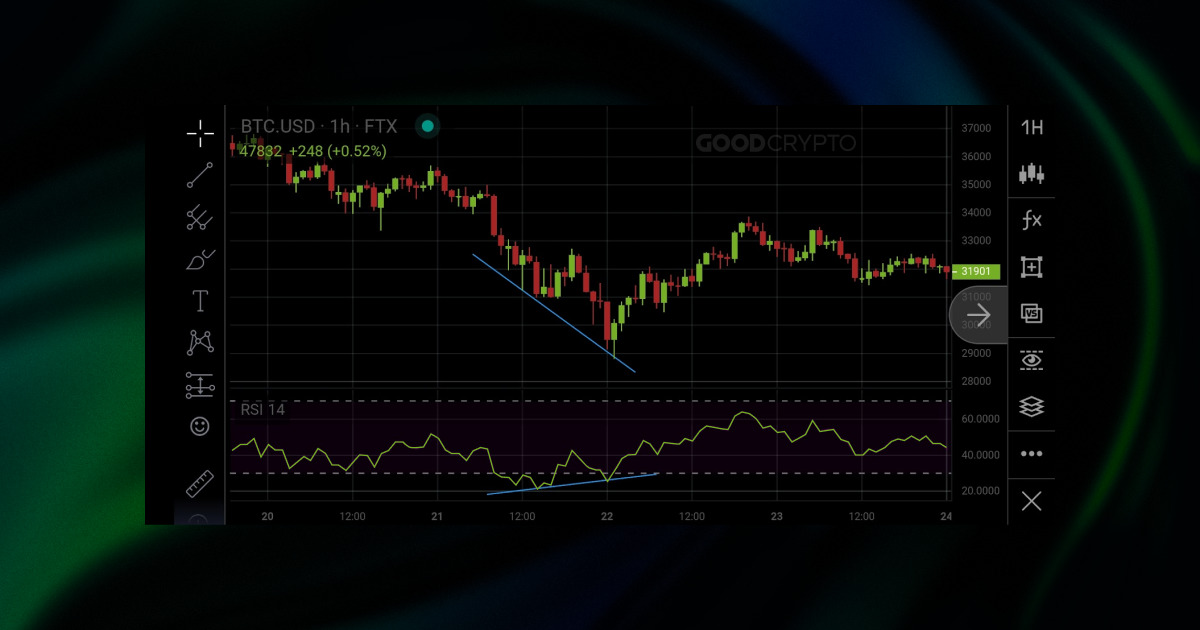
Bullish convergence, price makes LL and RSI makes HL.
An example of “bullish convergence”, because the market is showing to be oversold, and makes lower lows, yet, the RSI indicator is showing higher lows.
We can read this in another way. Although the price is going down, there seems to be a stronger buying strength as RSI is moving up. This means that the dip is likely going to be supported, and price will move up again after.
RECAP: When we see divergence or convergence in the tops (both in the price and the indicator) we are seeing sell signals. When seeing divergence or convergence appear in the bottoms (both in the price and the indicator) we are seeing buy signals.
RSI indicator breakout
The RSI indicator can be used to analyze a trend and thus you can create trendlines. A trendline is a straight line that is touched 2 times or more. More touches mean the trendline is stronger. When the RSI breaks a certain trendline, we call it an RSI indicator breakout. The example below shows how the RSI broke out of a downtrend, retested the trendline, and then made an upwards continuation.
How to use the RSI indicator in crypto trading?
Inside the Good Crypto application, navigate to the trading terminal. Choose the exchange and trading pair you want to trade, then tap the “fx” icon below the chart to add RSI indicator.
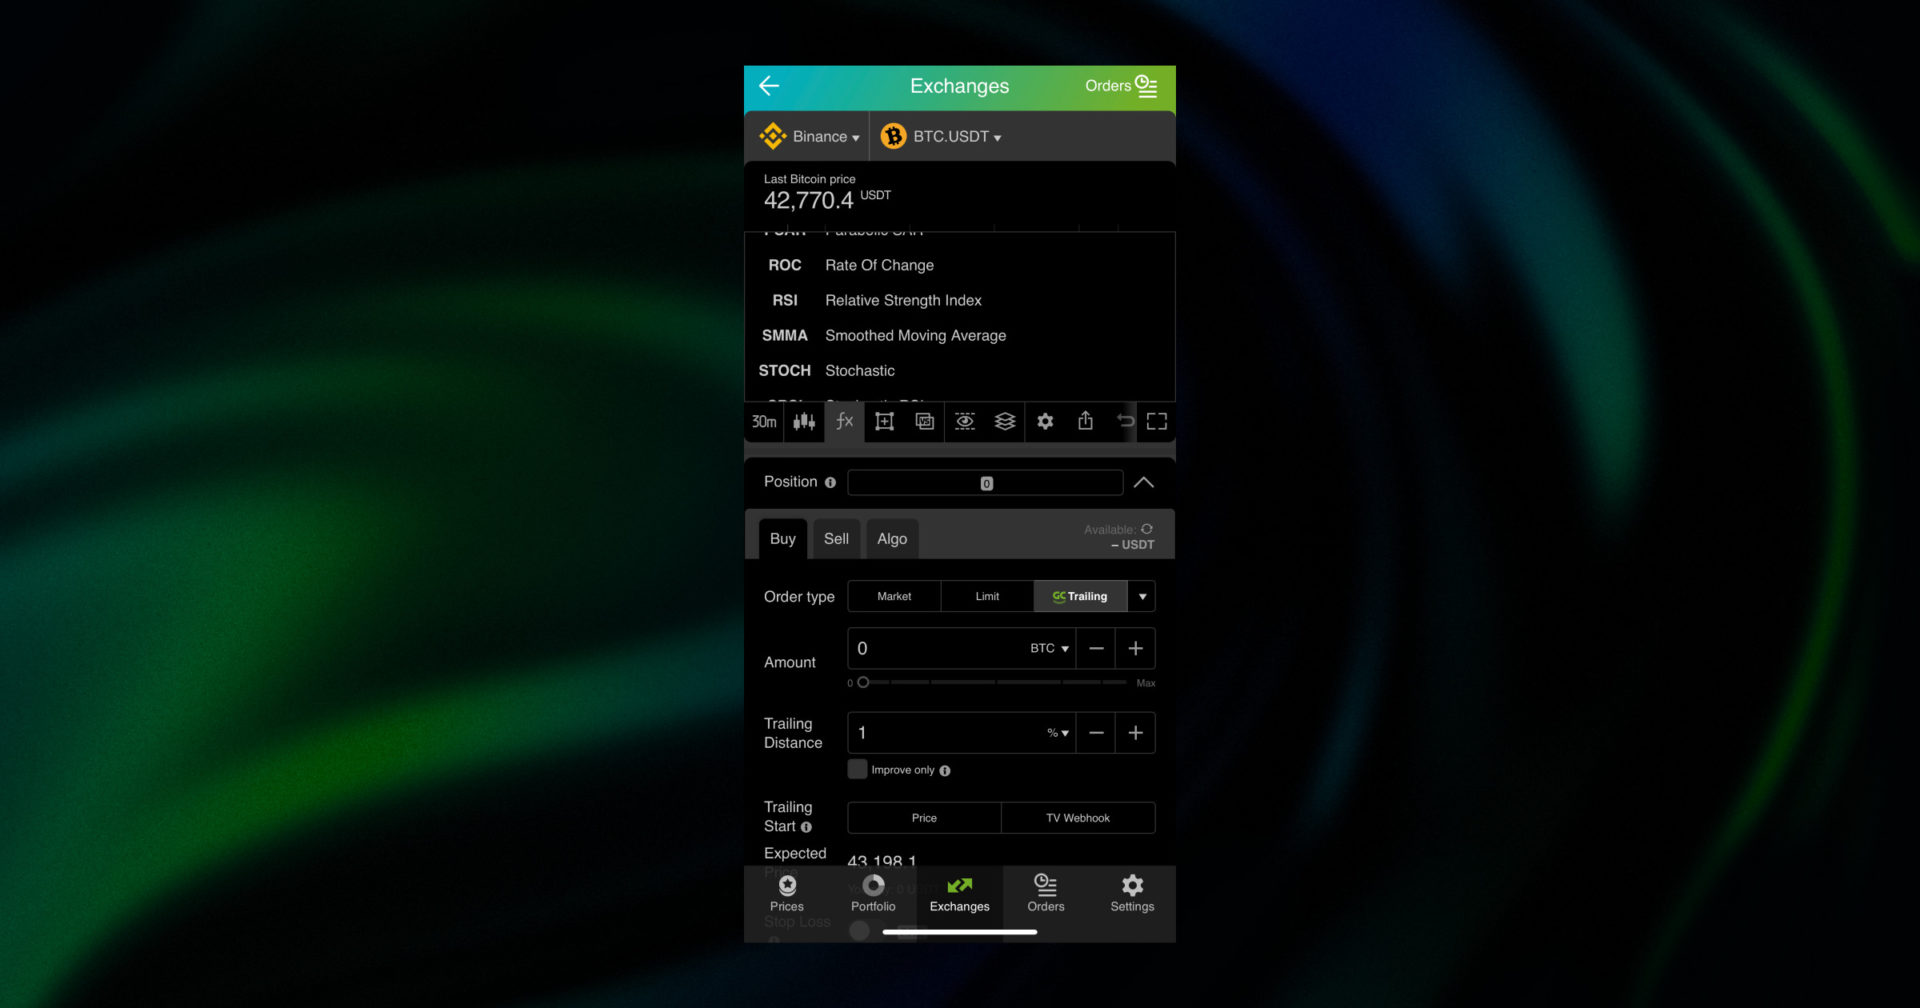
Once you enable the Relative Strength Index indicator, you can start looking for signals.
Don’t forget that the RSI period is always 14, since it’s a standard, we recommend you to keep it at those RSI settings.
Signals given on a higher timeframe will be stronger than signals given on the lower timeframes. This is very important because once you start using the crypto RSI indicator, you will notice that you could for example see a bearish divergence on the 15-minute timeframe, but not on the 1-hour timeframe.
Or another example, if you see a bearish divergence on the daily timeframe, it will be significantly more meaningful than bearish divergence on the 5-minute timeframe.
Now, let’s take a look at two RSI strategies that will help us better understand how to make a trading decision based on this crypto indicator.
How do you make a trading decision based on the RSI indicator?
RSI strategy #1: Overbought and Oversold Signals on a Trending Market
One method, as described on the crypto RSI chart above, is looking at overbought and oversold signals when the market is in a range. There’s no guarantee that you will catch the absolute bottom nor the absolute top. It is dangerous to simply buy based on an oversold signal since as we described, a market can keep falling even when the oversold signal was already given. Using the RSI alone is not enough, and therefore it’s not recommended to create a trading strategy based on this indicator alone. However, it helps you make decisions and gain insight, which is very useful. You can use different types of Moving Averages and Bollinger Bands together with RSI to confirm signals appeared and make a more informed trading decision.
-
RSI strategy #2: Trading based on Bullish or Bearish Divergence and Convergence
The second method, trading based on divergence, can be more interesting. When you are noticing a re-test for example in a bottom or a top formation in price, you can look for divergence in the RSI momentum indicator. When a double top shows bearish divergence, it’s a potential indication to sell. When a double bottom shows you a bullish divergence pattern, you potentially could place a buy order. Your stop loss can then be placed below the previous low since your analysis is based on the fact that there will be no new low. If there is a new low, then the analysis is proven to be wrong and your stop loss will be hit.
Having your Stop Loss hit should not be a big issue. Risk management is a vital part of trading. Essentially, you allow yourself and your strategy to be wrong now and then. A market is an unpredictable place, so you need to allow yourself the possibility to accept any outcome and still win over the long term. That’s why your Stop Loss should not cost you more than 1% or 2% of your trading portfolio. Ideally, you test and retest a strategy without using your money. Once, let’s say, RSI trading strategies are profitable on paper, you can use your money and win consistently.
This article does not contain investment advice or recommendations. Every investment and trading move involves risk, and readers should conduct their own research when making a decision.