
Understanding and Trading the Three Drives Harmonic Pattern
What is the Three Drives Pattern?
The three drives chart pattern is a formation consisting of three consecutive symmetrical price movements. Classified as a harmonic reversal pattern, it appears in two forms: bullish and bearish.
Traders use the three drives pattern to identify potential reversal zones in the live trading markets. Recognizing these zones allows traders to enter the market with long (buy) or short (sell) positions effectively.
How to Identify and Use the Three Drives Reversal Pattern in Trading
Like other harmonic patterns, identifying and constructing the three drives pattern is a multi-step process. Nonetheless, it’s a powerful reversal indicator that can improve profitability when trading. The GBP/USD chart below offers a clear illustration of the three drives pattern.
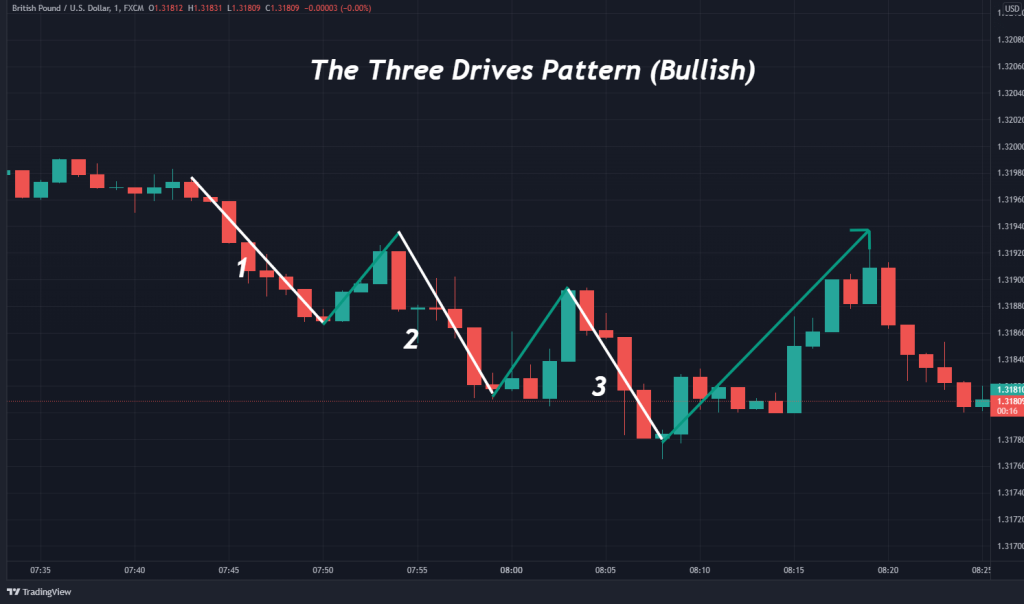
Here's a breakdown of the process used to identify and trade this harmonic pattern:
1. Identify the prevailing bullish or bearish trend.
2. Label the three consecutive directional price movements as 1, 2, and 3.
3. Confirm the pattern using Fibonacci extensions or retracements. This step is similar to the ABCD pattern but with an added leg. The difference is that the three drives pattern comprises five legs, while the ABCD pattern has only four.
4. Establish a market entry upon the completion of the third and final drive. This will be either a bullish or bearish reversal.
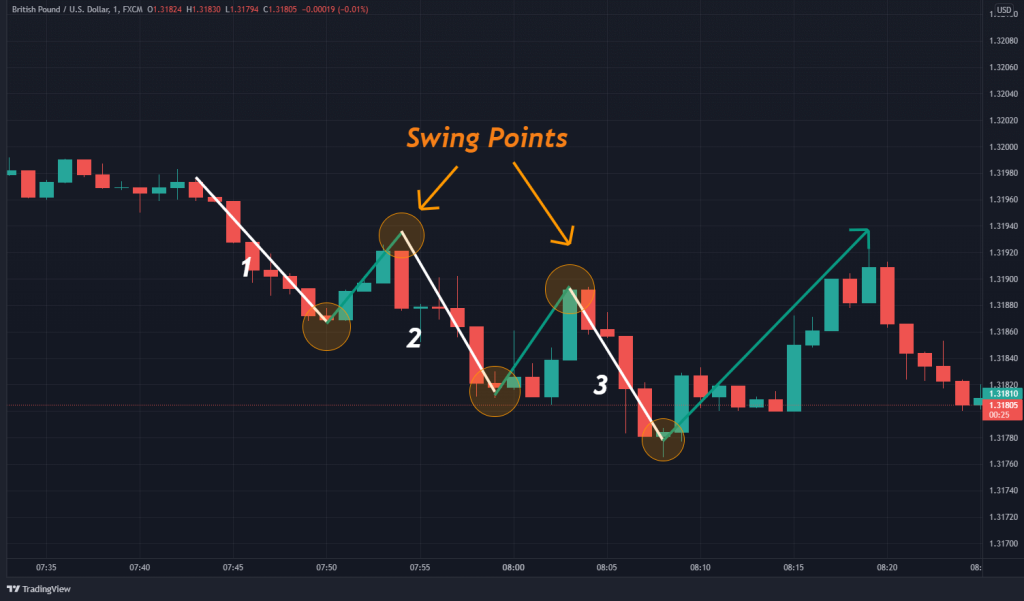
Previously Formed Swing Point
Identifying a previously formed swing point is critical in constructing a valid three drives pattern. A swing point is where the price pivots from the existing trend.
Swing points are vital elements of the three drives pattern. They serve as the price points from which Fibonacci extensions and retracements are applied. Below is an illustration of a swing point in a bullish three drives pattern.
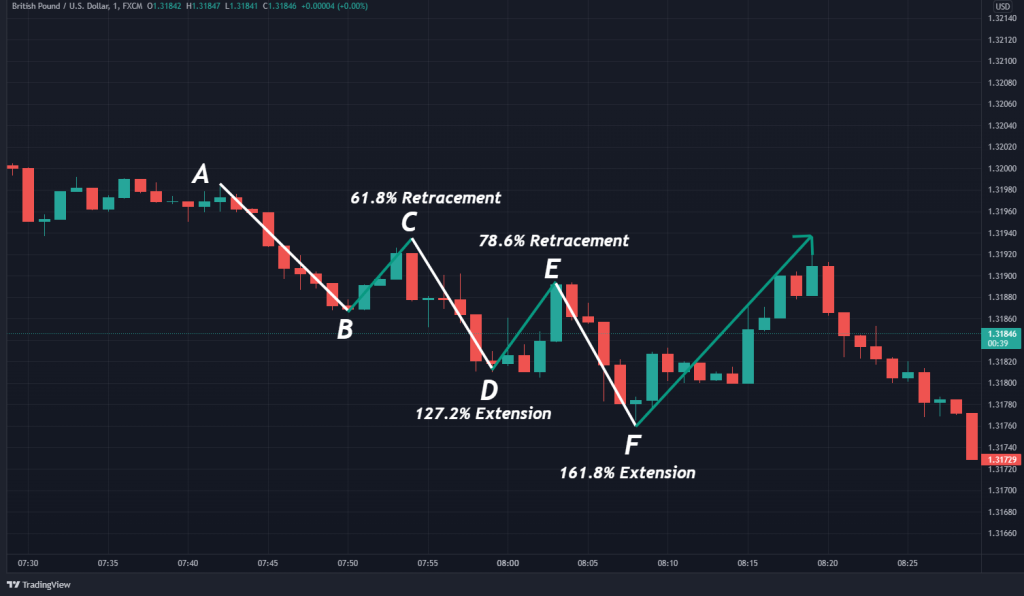
Fibonacci Extensions & Retracements
Symmetry in price action is crucial when identifying the three drives pattern. Fibonacci extensions or retracements establish this symmetry. Here's how each is applied to build the three drives formation:
- Fibonacci Extension: The last two drives, C-D and E-F, should represent 127.2% and 161.8% of the B-C and D-E pullbacks.
- Fibonacci Retracement: The B-C and D-E pullbacks represent 61.8% or 78.6% retracements of the preceding drive.
How to Trade the Three Drives Formation
All classical, harmonic, and single-candlestick patterns follow a specific procedure for trading. This involves determining market entry, setting a stop loss, and locating a profit target.
1. Market Entry
The three drives formation is a reversal indicator that occurs in both uptrends and downtrends. Thus, the pattern may act as either a bullish reversal (buy) or a bearish reversal (sell) signal.
Market entry for the three drives occurs after the third drive. For the bullish three drives pattern, buy above the third drive; for the bearish, sell beneath the third drive.
2. Stop-loss
Locating a stop loss with harmonic chart patterns relies on constructing the proper legs of the formation. For a bearish three drives, the progression is an upward move followed by a lower retracement. So, the stop loss is placed above the formation.
In a bullish three drives pattern, the stop loss is placed beneath the lower extreme established by the third drive.
3. Profit Targets
Traders use various techniques to set profit targets, such as risk vs. reward ratios, pattern height, or Fibonacci extensions.
With the three drives formation, profit targets are flexible and depend on factors like market volatility, strategy, and the time frame being traded.
Trading Example
The GBP/USD chart below provides a clear example of determining the precise entry point, setting stop losses, and aligning profit targets.
Here's how the GBP/USD trade was executed:
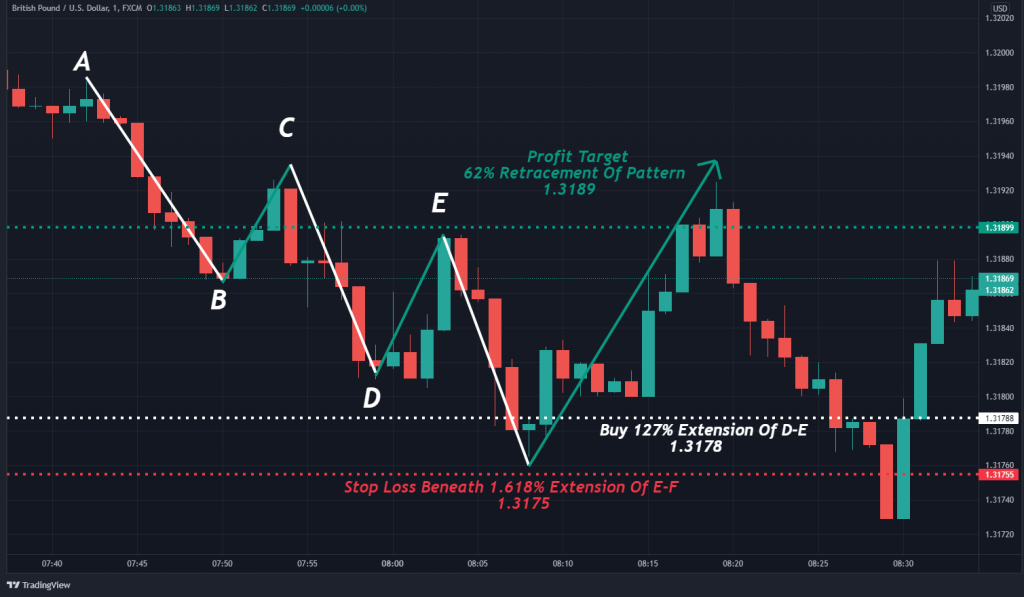
1. A pronounced downtrend was observed on a 1-minute GBP/USD chart.
2. The three drives pattern was constructed.
3. A buy order at 1.3178 was executed.
4. Stop-loss was placed beneath the pattern at 1.3175.
5. A profit target was set at 1.3189, the pattern’s 62% retracement.
6. An 11-pip gain was realized upon reaching the profit target.
Three Drives Harmonic Patterns – Pros and Cons
Every strategy, system, or analytical base has pros and cons. Here are some of the most relevant for the three drives chart pattern.
Pros:
- User-friendly and easy to recognize.
- Can generate significant profits when effective.
- Provides traders with a concrete stop-out point.
Cons:
- Does not frequently occur in all trading pairs.
- Expensive to trade on more extended duration price charts.
- Loses efficacy on compressed time frames.
Key Takeaways
- The three drives formation is a harmonic chart pattern consisting of three consecutive moves in price, each following a measured retracement.
- Three drives patterns are leading reversal indicators, providing traders with counter-trend buy and sell signals. A bullish three drives pattern occurs during a downtrend; a bearish pattern develops during an uptrend.
- Fibonacci retracements and extensions confirm the pattern’s symmetrical price movements.
By mastering the three drives pattern, traders can enhance their ability to identify profitable reversal opportunities in the dynamic world of trading, including crypto markets.
This article does not contain investment advice or recommendations. Every investment and trading move involves risk, and readers should conduct their own research when making a decision.