
The Adam and Eve chart pattern is a lesser-known yet significant reversal pattern identified within uptrends or downtrends. Introduced by Thomas Bulkowski in the "Encyclopedia of Chart Patterns," it offers traders insights into potential bullish or bearish reversals.
This pattern, akin to the double top or double bottom formations, features distinctive characteristics. Initially, there's the formation of the "Adam," representing the first peak or trough. Subsequently, the price action forms a second peak or trough, known as the "Eve," which typically has a rounded shape.
Unlike traditional double tops or bottoms, which feature two prominent peaks or troughs, the Adam and Eve pattern showcases a peak followed by a rounded formation. This nuanced structure provides traders with additional confirmation of potential trend reversals at specific price levels.
In essence, the Adam and Eve pattern serves as a valuable tool for identifying entry points, offering traders double confirmation of price movements failing to breach particular levels.
2 Types of the Adam and Eve Chart Pattern
There are two types of Adam and Eve patterns: double top and double bottom chart patterns.
1. Adam and Eve Double Bottom
Adam and Eve double bottoms are formed in a downtrend and create two bottoms before the price moves upward – the first bottom is the shape of a V (Adam) a peak at the support line while the second bottom is in the shape of a U (Eve).
2. Adam and Eve Double Top
The Adam and Eve double top is formed during an uptrend and makes two tops before the bearish reversal – the first is in the shape of an upside V (Adam), and the second is in the shape of an upside U (Eve).
How to Identify the Adam and Eve Chart Pattern in Trading?
As mentioned, the Adam and Eve has a pretty clear price formation. It has two peaks or bottoms but the shape of each price peak or bottom is formed differently. Let’s see and example.
In the chart below, you can see the Adam and Eve double-bottom pattern.
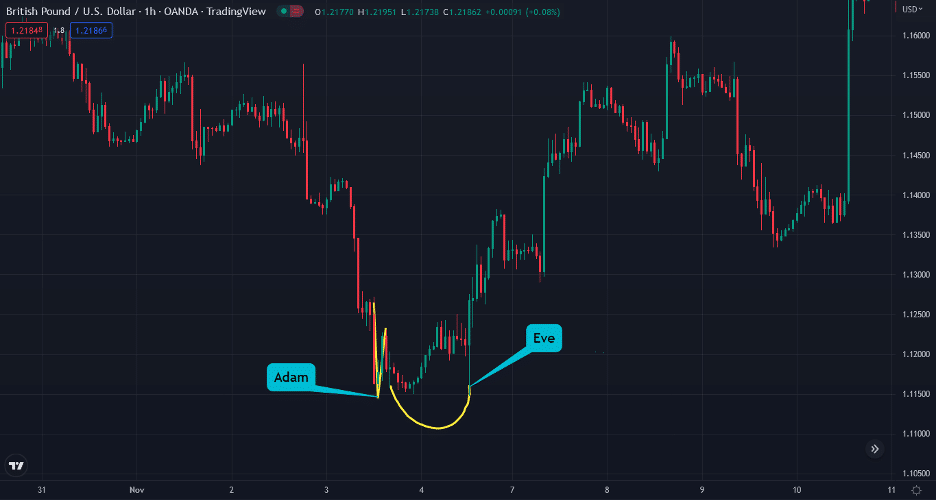
As you can see, the first low level has one bottom price while the second wave has several bottoms with a round shape of the U letter. Now, once the price breaks above the neckline level, it immediately rises to start a new bullish movement.
Note that Bulkowski suggested a high volume of supplies during the Adam formation for the bullish Adam and Eve pattern (and vice versa for the bearish pattern). This means that when volume increases around these levels, the trading signal is much more accurate.
With the above in mind, here are some crucial factors that will help you identify the Adam and Eve pattern.
- Trend – As mentioned earlier, Adam and Eve is a bullish and bearish reversal pattern. So, first, you need to identify the market trend and then look for the pattern.
- First Bottom or Top (Adam) – In a downtrend, the price must make a sharp bottom with a price peak. You can identify the sharp bottom as it appears in the shape of a V. The price makes a bottom and then moves up sharply with a large upswing. On the other hand, when the price makes an opposite V-shaped top in an uptrend, we can see Adam at the peak of an uptrend.
- Second Bottom and Top (Eve) – In Adam and Eve’s double bottom, the price action firstly creates the Adam shape, makes a top, moves downwards, and finally creates a U-shaped bottom. Conversely, in Adam and Eve’s double top, the price makes a sharp bottom, moves upwards, and develops an opposite U-shaped top.
- Use a Volume Indicator – As the Adam and Eve pattern is normally characterized by high trading volume during the pattern’s formation, it is best to add a volume indicator.
- Enter a position – As soon as the price rises above or below the neckline, you can enter a trade. Stop loss could be placed around the peak or bottom levels of the Adam or Eve formations.
How to Trade the Adam and Eve Chart Pattern – Trading Strategies
Trading with the Adam and Eve pattern is super simple. All you have to do is identify the pattern correctly and know the proper levels of when and where to enter and exit a trade.
Here are two ways to show you how to use the Adam and Eve pattern in forex trading.
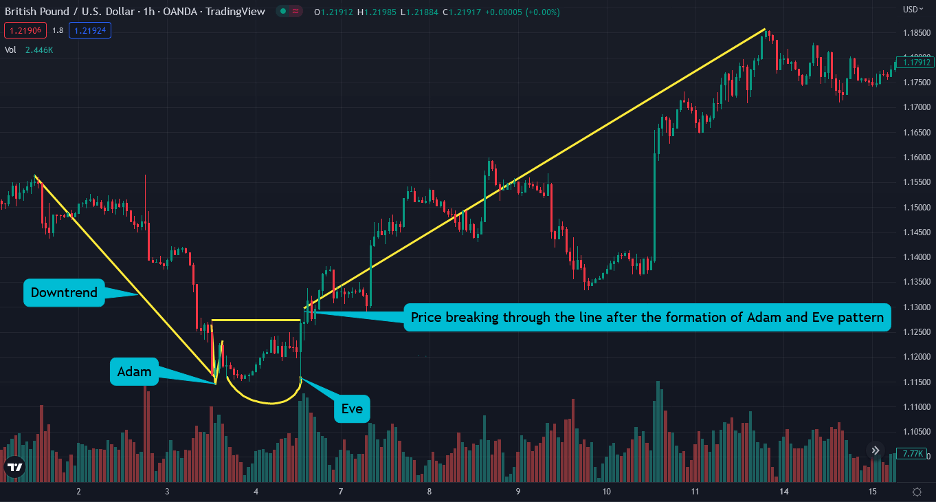
1. Adam and Eve Double Bottom Breakout Strategy
As previously mentioned, the Adam and Eve pattern creates a support level in the double bottom, meaning Adam and Eve have the same support level. So, whenever the price breaks above the highest resistance level of the Adam or Eve chart formation, you get a signal to enter a long position.
In the GBP/USD chart below, you can see how the price breaks the neckline level of Adam and Eve, and a new trend begins. Around this area, there is a high volume, which confirms the buying pressure.
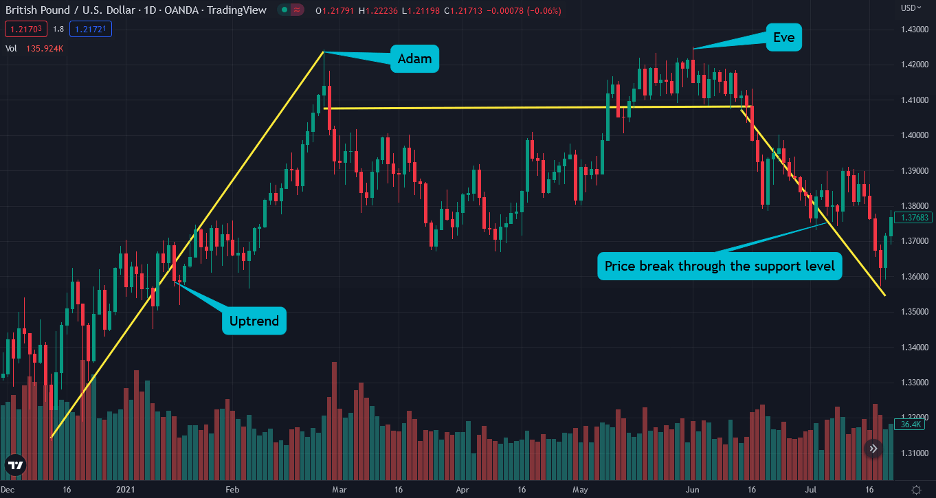
2. Adam and Eve Double Top Breakout Strategy
In a double-top pattern, the Adam and Eve pattern makes two tops. These tops signify resistance levels, with the first top being a peak while the other creates a rounded shape of high price levels. Also, when the pattern appears, we can draw a support neckline level. Ultimately, the signal is given when the price breaks the support level.
Let’s use an example. In the GBP/USD chart below, you can see how the price enters a consolidation mode after the first peak. At this point, you may identify a pattern that is very similar to the Wyckoff distribution phase. Then, once the price fails to break the same resistance several times in the second wave, the Adam and Ev pattern is valid.
Finally, when the price breaks the lowest level of Adam and Eve, a new trend begins. Therefore, a good level to enter a trade upon identifying the Adam and Even chart pattern is when the price breaks below the support level.
Finally, stop loss is located at the resistance level, and the take profit target could be placed at the lowest price swing level before Adam’s formation.
The Adam and Eve Chart Pattern – Pros and Cons
Like many other chart patterns, the Adam and Eve chart pattern has ups and downs. So, let’s see the pattern’s pros and cons.
Pros
- If the pattern is identified correctly, Adam and Eve present an exact entry point level
- The pattern is easily recognizable
- Once the price breaks through support (in double top) and resistance (in double bottom) levels, it is almost certain to continue in the direction of the breakout
Cons
- Even after making double tops and bottoms, the price can continue in the previous direction rather than reverse, creating a false signal
- The Adam and Eve pattern usually doesn’t work if there is a low trading volume in the specific market
Key Takeaways
Below you can find some of the key takeaways about the Adam and Eve pattern.
- The Adam and Eve pattern is a slightly different variation of the double top and bottom chart pattern that signals the start of a new trend
- When the bullish version appears, the first bottom, the Adam, has a V-Shaped. After Adam, the price makes a U-shaped consolidation phase, thus forming Eve. The same applies to the bearish version
- The best way to trade with the pattern is by utilizing the breakout trading strategy; Therefore, when the price breaks above the resistance line or below the support line, you should enter a trade with a stop loss at the neckline level
- Volume is an integral part of Adam and Eve, as it confirms the buying or selling pressure and, thus, provides a strong signal for a trend reversal
Frequently Asked Questions (FAQs)
Here are some of the most frequently asked questions about the Adam and Eve pattern in forex:
Is the Adam and Eve pattern bullish or bearish?
Yes, Adam and Eve can be a bullish or bearish reversal pattern that signals the start of a new uptrend or downtrend.
What is the Adam and Eve pattern?
Adam and Eve is a reversal pattern with two tops or two bottoms that signals the start of a new trend. Unlike the double top and double bottom chart patterns, the Adam and Eve pattern has a slightly different formation – the first top/bottom has a peak, while the second bottom/top has a rounded shape. It is known as an accurate and reliable chart pattern, especially when used in combination with other technical analysis indicators.
How accurate is the Adam and Eve chart pattern?
Adam and Eve is a highly accurate chart pattern as the price fails to break a crucial support and resistance level several times.
This article does not contain investment advice or recommendations. Every investment and trading move involves risk, and readers should conduct their own research when making a decision.