
The inside bar candlestick pattern is a commonly observed chart pattern in financial markets. This pattern is referred to as an inside bar due to the first candle fully engulfing the second candle, providing traders with a visual representation to anticipate the upcoming price direction.
What is the Inside Bar Pattern?
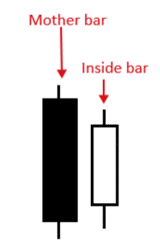
The inside bar is a two-candlestick pattern that signals trend continuation or reversal. The first candle of the pattern is usually large, called the mother candle, while the next candle is a small candle having low wicks, and is called the baby candle. In another case, when the mother bar does not appear, it’s also called the abandoned baby candle pattern.
The concept behind the inside bar pattern is that there is a temporary consolidation when the inside bars are formed or a decline in buying or selling pressure in the market following a large and significant price movement. Now, the inside bar setup may appear on both sides – meaning, when the pattern appears in an uptrend, it’s called a bullish inside bar pattern, while when it appears in a downtrend, it is called a bearish inside bar pattern.
Moreover, the pattern could be either a trend reversal or continuation chart pattern, depending on the context of the markets. It is also one of the most frequently seen patterns that appear regularly in any market condition. So, as you can assume, there’s no one version of the inside bar pattern.
Even though the pattern is known as having a structure with one large bullish or bearish first candle and a second smaller candle, it could have many other chart formations. For example, the inside bar pattern could also be formed with a large first candle and a second tiny Doji candle. Technically, as long as the first candle covers the second candle, then it’s an inside bar pattern.
In structure, the inside bar is similar to the inside day candle pattern with the only difference that inside day is used on a daily chart time frame while the inside bar candle pattern is used for intraday trading. Furthermore, occasionally it may appear inside another chart pattern formation, such as the three inside-up patterns when the first two candles are in fact inside bars.
How to Identify the Inside Bar Candlestick Chart Pattern in Trading?
As mentioned above, the inside bar is a two-candlestick pattern that may appear in any market scenario. Identifying the inside bar is not rocket science, and once you have a basic understanding of what it looks like, you will be able to locate it instantly on price charts. You just need to remember a few rules to identify the pattern correctly.
The first candle has a tall body, sometimes very large wicks, and is called the mother bar. The second candle has a small body, sometimes having low wicks, and is called the baby candle. The inside bar formation is completed when the second candle closes within the body of the mother candle.
Generally, although the inside bar is a two-candle pattern, the next candle after the second is a crucial one. As a matter of fact, the trade will be taken once the third candle is over.
So, let’s see an example first.
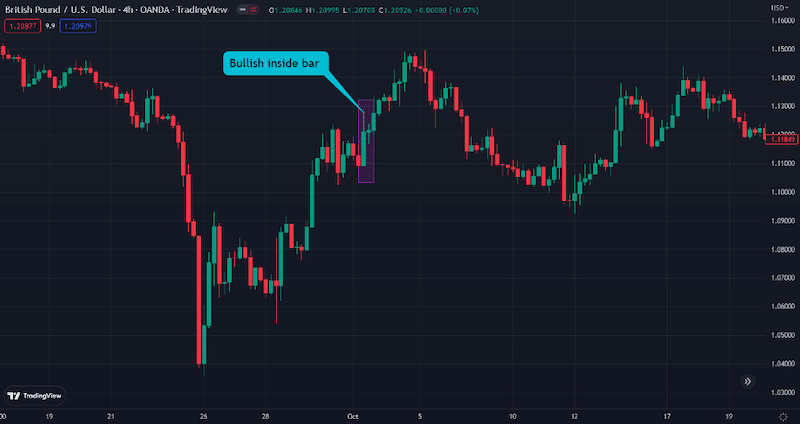
On the GBP/USD chart above, you can see a bullish inside bar. As discussed earlier, as long as the first candle covers the first candle, it is an inside bar pattern. Note how the price continues to trade higher after the appearance of the inside bar pattern and the confirmation of the third candlestick’s formation.
With the above in mind, here are a few steps to help you identify and trade the inside bar pattern:
- Identify the mother and the baby candles in an uptrend or downtrend.
- Make sure the baby candle closes within the mother candle.
- Wait for the next candle to close and indicate the next price movement.
- Add other technical analysis tools such as Fibonacci retracements, MACD, RSI, and moving averages
- Enter long or short positions after the formation of the pattern.
Inside Bar Chart Pattern Trading Strategies and Examples
You can apply plenty of trading strategies when trading inside bars. As mentioned, the inside bar candle pattern can appear in a downtrend or an uptrend and indicate a reversal or trend continuation.
So, you cannot trade every single inside bar the same, as you may not know if the trend will reverse or continue. Instead, it would be best to interpret the pattern differently on the market scenario and decide the next price direction. Still, the inside bar allows you to identify a pause in price action and a good market entry level before the next price movement. That’s what this pattern is all about.
So, a good solution is to apply an indicator or a tool that works well with the inside bar. For that matter, you can use support and resistance levels, a Fibonacci retracement tool, MACD, RSI, and MAs.
Below, we will show you two market examples to trade the inside bar pattern – range and breakout trading strategies.
1. Range Trading
The first way to trade the inside bar pattern is in a ranging market. After all, the second candle indicates a slowing buying or selling pressure following a large candle, which sometimes signals the beginning of an inside bar consolidation range in the market, or the market has found a new market equilibrium.
We added the Relative Strength Index (RSI) indicator as our confluence trading tool to see if the price continues with the trend, reverses, or stays in range mode.
The chart below shows that the inside bar candle pattern immediately appears following a sharp downward move. Then, a large bullish candle appears, followed by a bearish candle within the first candle’s body.
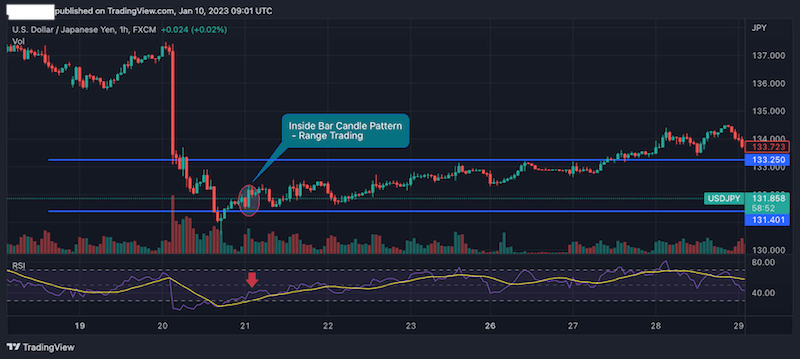
As you can see, when the inside bar pattern appears, the RSI stands at around 40-45, a level indicating indecision and the market and, thus, the likelihood of consolidation.
In this case, you will enter a trade intending to capture small price movements inside a range area, hence, support and resistance levels.
2. Breakout Trading
The second way to trade the inside bar pattern is the inside bar breakout trading method, which many believe is slightly more exciting to trade. This time, we identified the inside bar formation with a very large bullish candle followed by a smaller bearish candle covered by the first candlestick.
The critical point here is the third candlestick that rises above the second candle and indicates that the price is likely to increase. To confirm that, we used a basic moving average indicator, and, as seen in the chart, the crossover occurs precisely at the formation of the mother candle (the first candle).
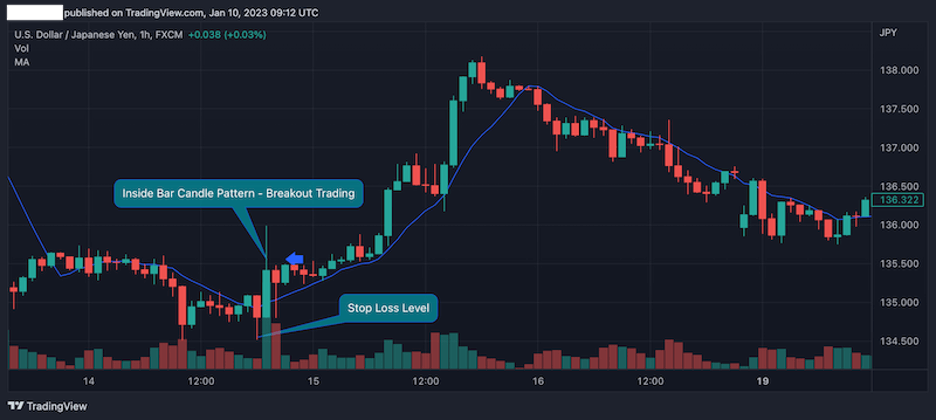
So, a buying signal is given once the third candle closes above the previous bar. Additionally, the volume provides another confirmation that buying pressure is building up.
As for stop loss, an order could be placed at the lowest price level of the mother candle or at the lowest level of the previous price swing (as shown in the chart). Finally, take profit is placed at the highest level of the last swing price.
The Inside Bar Candlestick Pattern – Pros and Cons
No pattern is the holy grail of trading, and the inside bar pattern, like many other classical chart patterns, has strengths and weaknesses. So let’s see what these are.
Pros
- Inside bar patterns frequently appear in the markets
- You can identify the pattern easily
- The inside bar can be used as a trend reversal and continuation signal
- The profitable inside bar setup pattern enables you to find many trading opportunities, especially for intraday trading techniques
Cons
- Signals from the inside bar pattern can be pretty confusing as it is unclear where the market is heading
- The pattern must be combined with other tools
- Traders that trade the inside bar pattern must interpret and analyze the market’s sentiment
Key Takeaways
In a nutshell, here are the main takeaways from identifying and trading the inside bar chart pattern.
- The inside bar is a multiple inside bars chart pattern, providing a short pause in price action
- Depending on market conditions, the inside bar pattern can be a trend reversal or continuation pattern
- The pattern consists of a mother candle and a baby candle. Though it is a two-candle pattern, the third candle indicates the market’s direction
- To use the pattern correctly, it is best to add indicators or tools like support, resistance, moving averages, RSI, and Fibonacci
Frequently Asked Questions (FAQs)
Here are the most frequently asked questions about the inside bar candlestick pattern:
Is the inside bar a good trading strategy?
Yes, it is. When combined with other tools or indicators, trading with the inside bar provides an excellent and straightforward smart trade management strategy. Although it is not a decisive chart pattern like many other chart patterns, it certainly enables traders to find many trading opportunities.
What is the best time frame for trading the inside bar candle pattern?
Generally, the longer the time frame, the better the signals the inside bar pattern provides. However, the pattern is certainly more suitable for short-term trading techniques. If you are a scalper, you can use the inside bar in a 15-minute timeframe or lower.
Using this forex trading strategy, you look for the inside bar in an uptrend or downtrend, wait for the pattern to fully appear, and double-check the price action through an indicator or support/resistance levels. After that pause in price action, you can find an inside bar trade.
Is the Inside bar candle pattern bullish or bearish?
The inside bar pattern can be bullish, bearish, or neutral. It is one of the few chart patterns that does not necessarily signal a directional change. Instead, it provides a price pause before the next price movement.
This article does not contain investment advice or recommendations. Every investment and trading move involves risk, and readers should conduct their own research when making a decision.