
In the financial markets, where every decision is a step towards profit or loss, having an edge over the market is invaluable. Now, imagine having the power to naturally spot trading opportunities others might miss, all while simplifying your strategy.
That’s where the Fair Value Gap trading strategy comes in. This strategy, used mainly by price action traders, is extremely simple yet incredibly powerful.
What is the Fair Value Gap (FVG)?
The concept of fair value gap goes by different terminologies among price action traders. Some call it imbalance, inefficiency, or liquidity void. But what exactly are these imbalances? They occur when buying and selling forces exert significant pressure, leading to substantial and rapid price movements. These movements, whether bullish or bearish, create gaps in the market, which are essentially the bread and butter of the FVG strategy.
The FVGs concept is rooted in the belief that the market naturally tends to correct itself. These price disparities or inefficiencies are not sustainable in the long term, and the market tends to gravitate back towards them before continuing in the same direction as the initial impulsive move.
Now, why are FVGs so crucial for price action traders? They provide a unique advantage by revealing entry and exit points in the market. Like many other types of price gaps, these FVG imbalances act as markers on the chart, guiding traders on when to get in and out of a position. However, the fair value gap differs from other price gaps.
Unlike other gaps where there’s no trading activity on a price chart, the FVG is based on a three-candlestick formation that creates an imbalance in the market’s price action. When this substantial move suddenly occurs, whether upward or downward, it leaves a gap between the first candle’s wick and the final candle’s wick; this is the FVG.
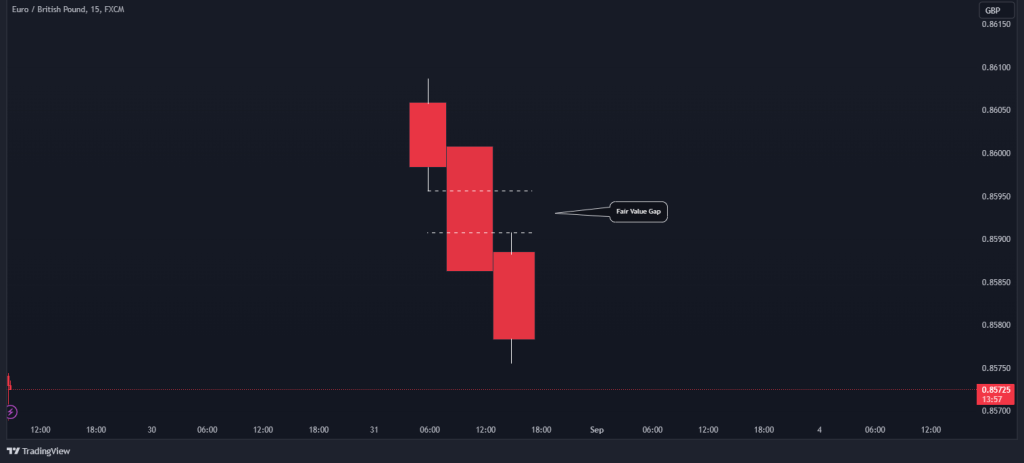
The gap in the above chart signifies an opportunity – a potential return to equilibrium. In this example, we can see the three-candle bearish formation where the lowest price of the first and the highest price of the third candle leave a hypothetical gap. Usually, following this formation, the markets tend to create a U shape and turn back to fill this gap.
It’s at this juncture where liquidity voids occur that traders can make informed decisions, leveraging the power of FVGs to capitalize on market corrections and profit from the realignment.
How to Identify a Fair Value Gap on a Price Chart
Like most chart patterns, the most tricky part of the fair value gap strategy is identifying this unique formation on a price chart. In the case of FVGs, a three-candle pattern must appear with specific rules. Then, when this happens, the space or gap between the wicks of the first and third candles is the fair value gap.
Here is how to identify an FVG on the chart:
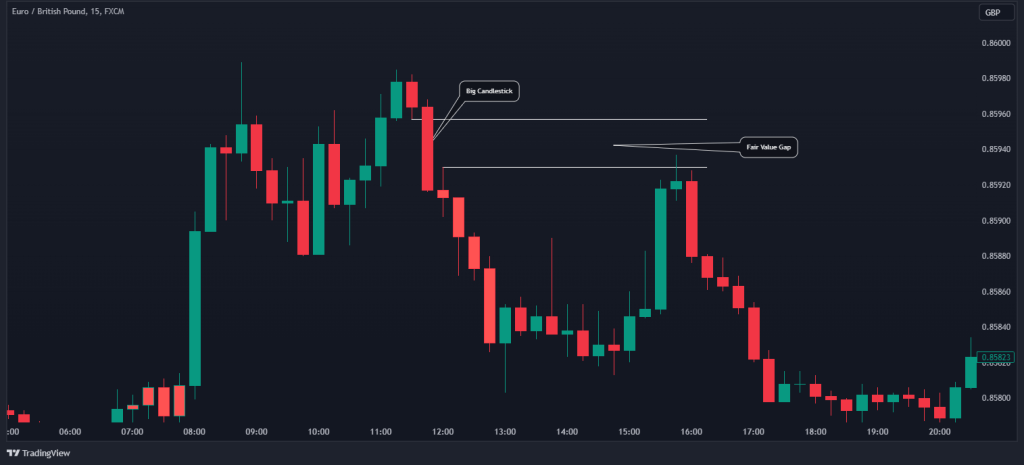
- Spotting the Big Candlestick: The first step in identifying a Fair Value Gap is to look for a substantial candlestick on your price chart. This candlestick should have a significant body-to-wick ratio, ideally around 70%.
- Analyzing Neighboring Candlesticks: Once you’ve identified the large candlestick, analyze the ones immediately preceding and following it. These neighboring candlesticks should not overlap the significant one entirely. Instead, minor overlaps may occur on the upper and lower sides of the substantial candlestick. Then, it is the gap between the wicks of neighboring candlesticks that create the fair value gap.
- Defining the Fair Value Gap: Finally, you must define the fair value gap and draw it on your price chart. In a bearish trend, the Fair Value Gap is the price area between the previous candlestick’s low and the following candlestick’s high. This is where the imbalance in the market becomes apparent, signifying a potential trading opportunity. The same applies to a bullish trend but with the opposite conditions.
In the EUR/GBP 15-Min chart below, you can see what the fair value gap candlestick pattern looks like on a price chart. Once you notice a big candlestick with a small candle prior to it and another small candle that appears after the big candlestick, you can search for the fair value gap entry level.
Additionally, Fair Value Gaps come in two distinct flavors, each carrying its own set of implications for traders:
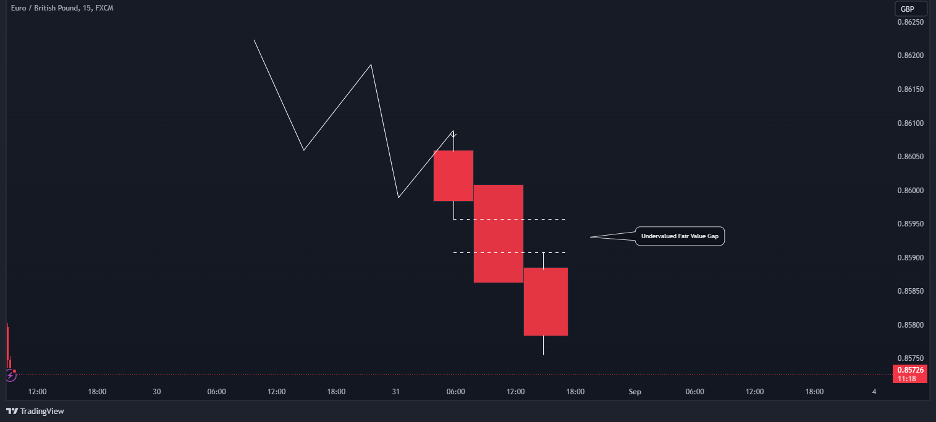
1. Undervalued Fair Value Gap (Bearish Fair Value Gap)
This type of FVG suggests that the price of a currency pair or any other financial asset is currently below its fair value. In simple terms, traders can anticipate that the market will retrace to correct this inefficiency. When you spot a significant bearish candlestick on your chart, it’s likely signaling the presence of an undervalued FVG.
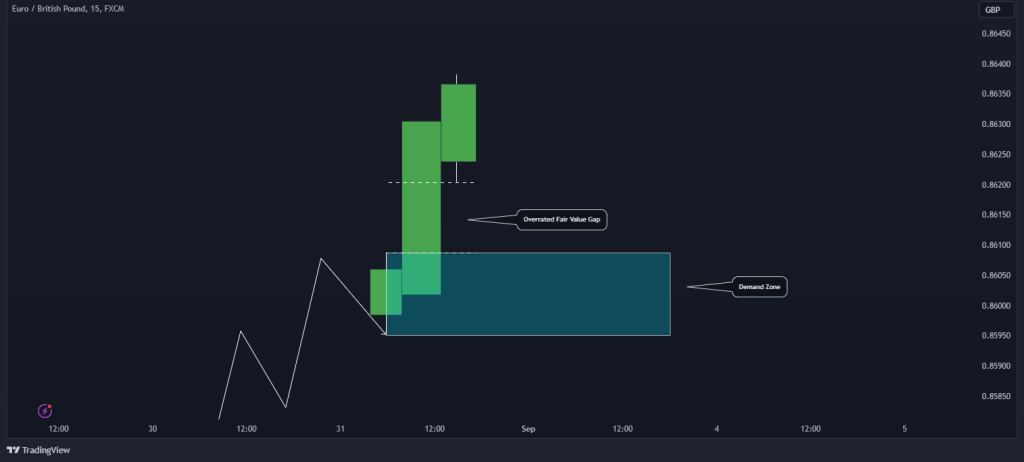
2. Overrated Fair Value Gap (Bullish Fair Value Gap)
Conversely, an Overrated FVG indicates that the price of a currency oaur or financial asset is currently trading above its fair value. Here, the market is overheated, and a correction is on the horizon. Traders can expect the price to retrace as the market balances itself before going up.
How to Trade Using FVGs – The Fair Value Gap Trading Strategy
Ultimately, the most important part is to learn how to trade fair value gaps. The main reason why fair value gaps are usually connected to price action traders is that experienced traders can see it naturally. Once you learn how to identify a fair value gap on a price chart, then you’ll know when and where you should enter and exit a trade.
Also, keep in mind that there are several to trade the markets when FVG has been identified. For instance, some traders enter a trade expecting the markets to go back to fill the gap. Others wait for the gap to get filled and then enter a trade with the direction of the initial price movement.
Since the second method is considered more reliable, in this section we will show how to use this FVG trading strategy. So, here’s how to trade it:
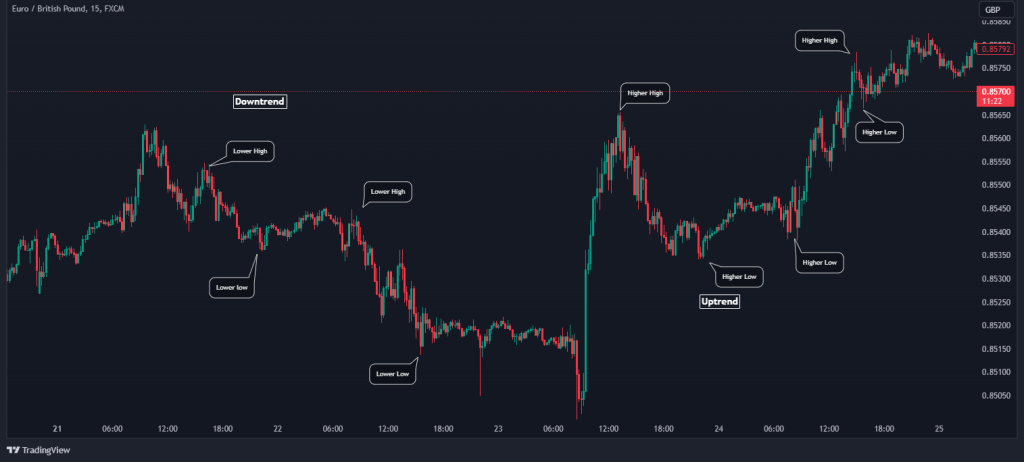
1. Determine the Trend
Trends play a pivotal role in this strategy. If the price is consistently forming higher highs and higher lows, you’re in an uptrend, and you should be looking to buy entries. Conversely, if the price is forming lower highs and lower lows, it indicates a bearish trend, and you should focus on selling entries.
Establishing the trend direction provides you with a fundamental framework for your trading decisions. If needed, switch to higher time frames, such as 1H, daily, and weekly. Also, to identify the market’s trend, you can trend lines and trend channels.
2. Identify Supply and Demand Zones
Once you’ve determined the trend, the next step is identifying supply and demand zones or order blocks that align with that trend. The simplest way to draw supply or demand zones is using the first candle that formed the FVG.
In the context of a bullish trend, pay particular attention to demand zones. These zones are areas where buying interest is strong and can potentially drive prices higher. Conversely, in a bearish trend, you’ll want to focus on supply zones, where selling pressure may dominate. The goal here is to pinpoint areas on the chart where significant price movements are likely to occur.
3. Use FVG to Determine the Entry Point
Next, you should identify the formation of the fair value gap. To do this, you can make use of the Fair Value Gap Indicator by Lux Algo on TradingView, which is a powerful tool to identify FVGs automatically. In the example below, you can see supply zones closest to an FVG during a bearish trend. When the price closes the gap, you should consider entering a short-sell position.
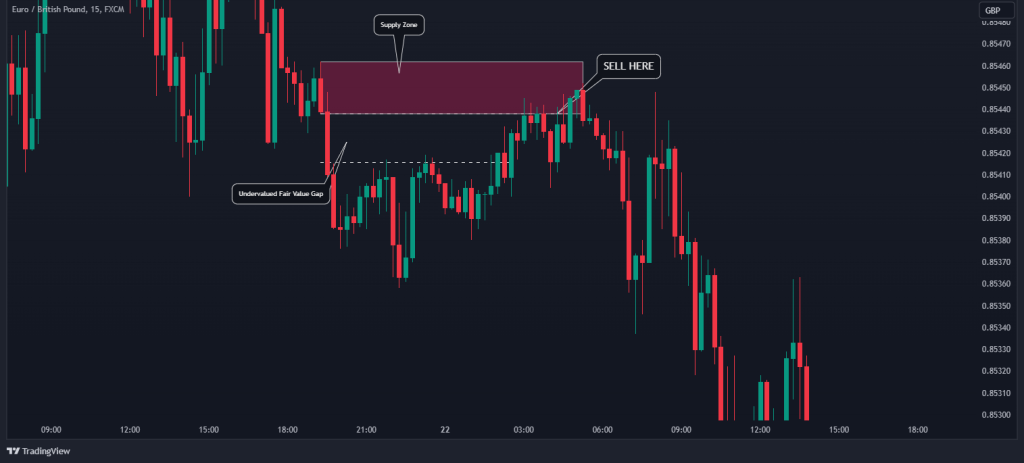
Remember, the presence of an FVG suggests a market imbalance that is likely to be corrected, potentially resulting in favorable price movements in your favor. Following the correction, the price is likely to move in the direction of the big candlestick or the initial price movement.
4. Set Stop Loss and Target Profit
As with any trading strategy, risk management is vital. When executing trades based on the FVG strategy, set appropriate stop loss and target profit levels. If you’re entering a trade from a supply zone, you should place your stop loss above that zone or, even better, above the first candle of the FVG three-candle formation. This helps protect your capital in case the market moves against your position.
Your take-profit target should be set just above the next demand zone in the direction of your trade. This zone represents a likely point where the market could reverse, allowing you to secure your profits. However, you can use this level to extend your earnings in case you notice a significant trend that is about to break the support level.

As you can see, the FVG trading strategy enables you to use a favorable risk-reward ratio. The main reason for that is the use of support and resistance levels as a protection tool.
Frequently Asked Questions
Here are some of the most popular questions on Fair Value Gaps:
What is the FVG level of trading?
The FVG level of trading refers to the point in the market where a Fair Value Gap (FVG) occurs. FVGs are discrepancies between the actual price of a financial asset and its perceived fair value, often caused by market inefficiencies. Identifying the FVG level involves recognizing these gaps on price charts, which traders can use to make informed decisions about potential price corrections and market opportunities.
What is the difference between imbalance and Fair Value Gaps?
Imbalance and Fair Value Gaps are closely related concepts in trading, but they have distinct implications. Imbalance refers to the disparity between buying and selling pressures in the market, leading to significant price moves. Fair Value Gaps, on the other hand, specifically pertain to the gaps formed on price charts due to these imbalances. While imbalance signifies the underlying forces at play, Fair Value Gaps are the visible outcomes of these imbalances, representing potential trading opportunities.
What is the smart money concept of FVG?
The smart money concept in relation to Fair Value Gaps (FVGs) suggests that well-informed and institutional investors (“smart money”) often exploit FVGs for profit. These savvy traders recognize the inefficiencies in the market and position themselves to benefit from the eventual price corrections that FVGs tend to prompt.
Do fair value gaps always get filled?
While the general principle is that Fair Value Gaps (FVGs) tend to get filled, it’s not an absolute rule. FVGs represent market imbalances that are expected to correct themselves over time, drawing prices back to the perceived fair value. However, external factors, sudden shifts in sentiment, or unexpected market developments can influence whether or not a specific FVG gets filled.
This article does not contain investment advice or recommendations. Every investment and trading move involves risk, and readers should conduct their own research when making a decision.