
Every week, new tokens are listed on various crypto trading platforms, offering opportunities to those interested in day trading or swing trading activities. In this article, I will focus on the Binance crypto exchange and how you (trader) can benefit from its high liquidity. But the question is…
How Do You Make Money with Newly Listed Coins on Binance
Currently, Binance is the world’s largest cryptocurrency exchange, providing significant liquidity to the cryptocurrency market. Due to the exposure and popularity that Binance gives to crypto projects launched on its platform, every cryptocurrency founder wants their tokens listed on the Binance exchange.
For founders, having their tokens listed on Binance is like fulfilling a childhood dream of playing for Real Madrid as a footballer or playing for the Los Angeles Lakers as a basketball player. So you can see that the stake is high.
Why Binance?
Most projects listed on Binance enjoy a high success rate due to its large trading volume. This enables traders to quickly execute trades without worrying about liquidity. However, new tokens listing on Binance can also serve as an opportunity for others to dump tokens received through airdrops, staking rewards, and ICOs.
So, you must be smart to avoid being used as exit liquidity.
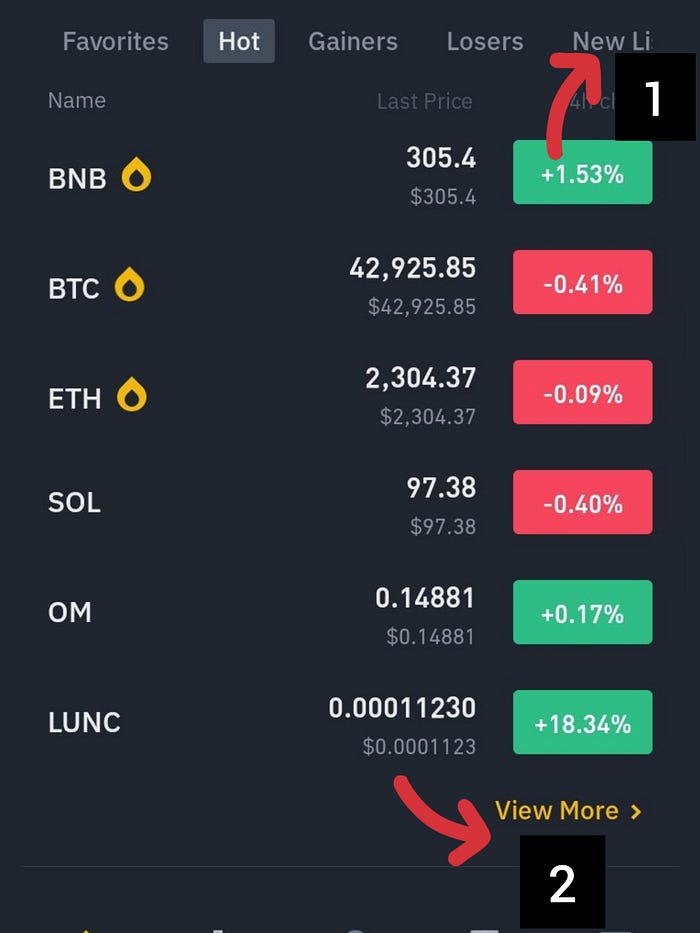
To get started, open your trading App ( Binance), and look for “New Listings” on the homepage. Click on it, and then click on “view more” to see the full page. (See 1 & 2 in the image above).
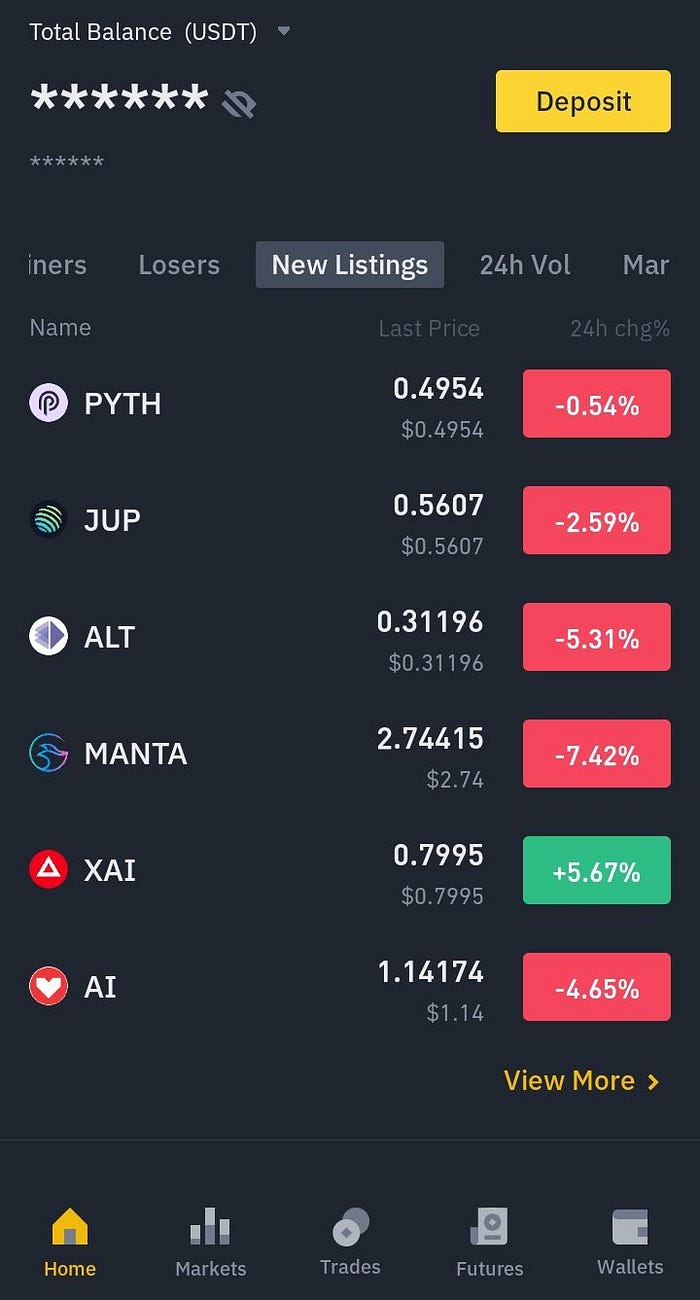
From the screenshot above, PYTH, JUP, ALT, and MANTA are among the four newly listed coins on Binance. For this example, we will choose the JUP-USDT pair. So, click on the pair to see the price movement.
While observing the chart, do not rush to buy the coin on the launch date, otherwise, the market makers may dump their tokens on you. Instead, add the coin to your watchlist, close your app, and check back the next day so you can have more data.
The Battle Between Algo Traders and You

When new projects are launched on any major centralized exchange, traders using algorithm trading software usually outsmart other traders by having their bids filled within the first few seconds or minutes. As a result, your “Limit Orders” won’t get filled, since you’re competing against trading bots. (See the 5-minute candle in the image above).
However, you should not compete with trading bots. Instead, stay on the sideline for a few hours or days, and watch the market makers do their stuff.
After a few hours, open your chart and set the timeframe to 1-H. Also, add EMA-20 and observe how the asset interacts with it. See the screenshot below.
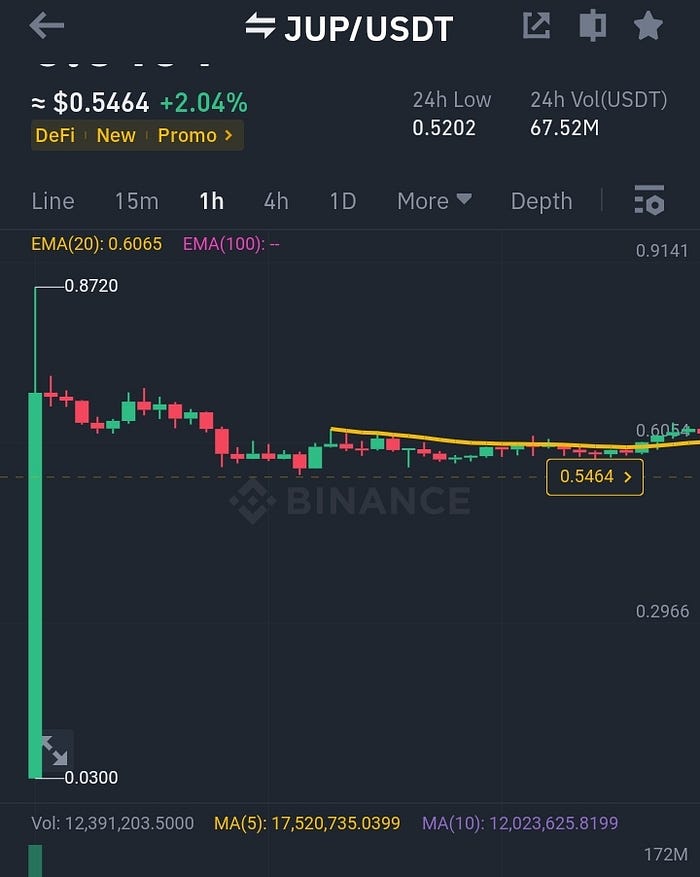
If it breaks and closes a green candle above the 20 EMA on the 1-H timeframe, it indicates bullish momentum, and you should get ready to take a buy position. You can buy a small position and wait for the 4-H confirmation.
On the other hand, if the pair is trading below the 20 EMA on the 1-H timeframe, stay away and continue to monitor the pair. Do not panic and FOMO into it. See the two screenshots below.

Higher Timeframe Analysis
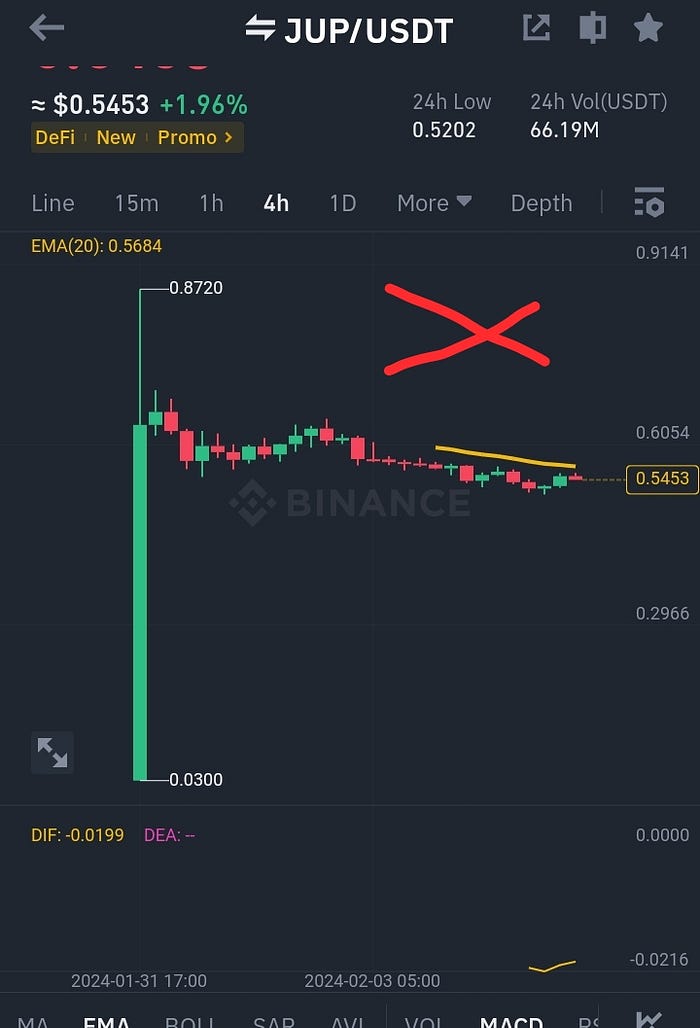
From the example above, the JUP-USDT pair is bearish. When trading with this strategy, I prefer to use the 4-hour timeframe. To do this, change the interval to 4H and add EMA 100 to your chart, along with EMA 20.
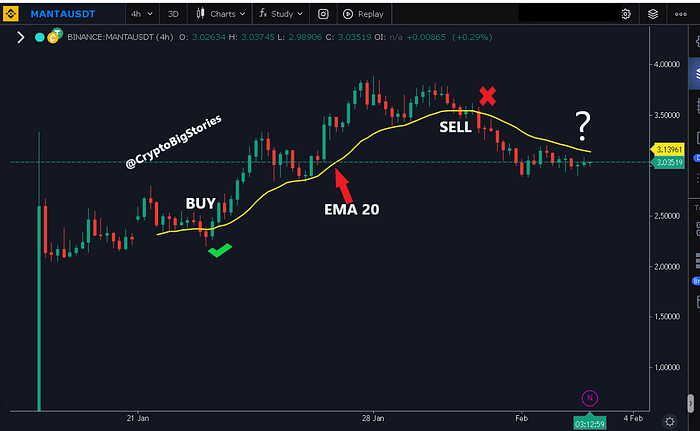
Remember, the trend is your friend, so don’t trade against it. Wait for the asset to break and close above the 20-EMA (yellow line) on the 4-hour timeframe before taking “Buy” positions. Once your buy order is filled, place your stop loss below the 4-hour candle leading to the breakout.
Since we have no previous data about the JUP-USDT pair, we can’t identify previous support/resistance zones except by relying on EMAs and Fibonacci levels.
Therefore, whenever the pair breaks above the 20 EMA on the 4-H, I will take a buy position and keep it open for several days without moving my stop loss. This way, I’ll gather more data about the coin while letting my trade run. See the MANTA-USD pair below.
Sometimes we may have drawbacks, but don’t panic if you set the right stop loss.
The market usually fluctuates to create fear and panic to shake out the weak hands before making the next move.
Once you have your position filled and stop loss target set in place, it’s time to target your take-profit levels.
Note: I don’t use leverage while applying this strategy. Since most newly listed coins are highly volatile, I can easily target $3,000 profits from a $10,000 position size with a 30% move to the upside. However, sometimes, you may incur losses if the trade goes against you. Hence, it’s important to understand that there’s no perfect trading strategy, so always manage your risk.
Take Profit Target
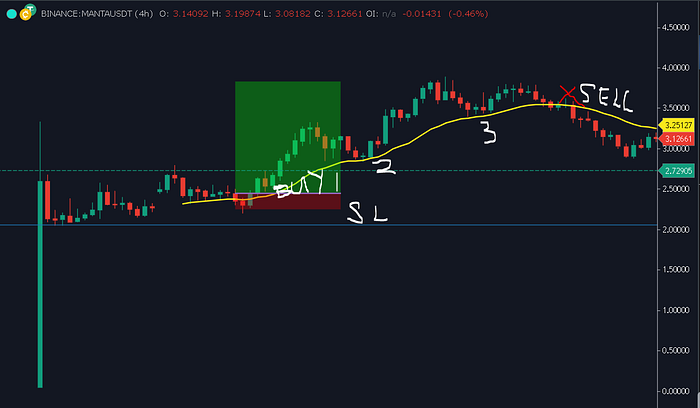
Using the 4-hour timeframe, you should take partial profits when the pair breaks and closes below the 20 EMA for the first time. Then, let about 60% of your position keep running, and move your stop loss above the entry to lock in some profits.
If the asset reacts with the 20-EMA without closing below it, that area will serve as your next support level. (See 2 and 3 below).
Bearish Scenario
Next, pay attention to what happens on the 1-hour timeframe and add the 200 EMA to your chart. This way, you have more data for analyzing the chart. See the screenshot below.
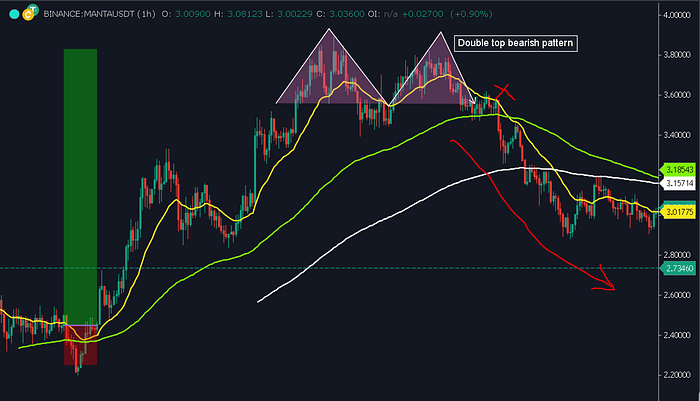
If the price drops below the 20 EMA, both the 100 and 200 EMAs (green and white lines) should act as supports on the 1-hour timeframe. Unfortunately, the support zone didn’t hold in the screenshot above. Also, we had a double-top formation on the chart, which confirms a strong bearish sentiment.
When these bearish signs are on your chart, and the asset fails to break above the 20-EMA on the 4-hour timeframe, you may take profits and exit your position.
By then, you would have made over (30–50)% profits.
Another method you can use to set take-profit targets is to use the Fibonacci tool.
The Fibonacci retracement tool is freely available on TradingView. Add it to your chart and note the key levels, such as the 23.6%, 38.2%, and 61.8%. We will learn about that in subsequent articles.
This article does not contain investment advice or recommendations. Every investment and trading move involves risk, and readers should conduct their own research when making a decision.