
The Wyckoff Method is a technical analysis technique that assists traders in making informed investment choices in the conventional financial markets. By examining the patterns of supply and demand, traders can evaluate the market index to determine its performance.
In order to effectively employ this method, Wyckoff suggests evaluating the methodology through the interpretation of charts (specifically, point and figure charts) along with a set of principles, techniques, and rules to monitor market movements.
The Wyckoff Method is a trading technique that focuses on analyzing the accumulation phase of a price chart. It is designed to help investors and traders identify the activities of larger players and smart money within a specific range, where they have left discernible patterns.
Richard Wyckoff, the creator of this method, developed it during the 1930s. As a prominent figure in the field, his teachings have greatly influenced modern technical analysis. Over the years, numerous traders have been inspired by his method and have achieved success in the industry. Today, the Wyckoff method is widely regarded as a reliable trading approach for interpreting price movements, often used in conjunction with Dow Theory and Elliott Wave analysis.
Wyckoff's belief was that significant players and smart money strategically accumulate orders before executing price moves. His method aims to decipher the activities of smart money and predict the direction of price movements by utilizing the fractal nature of price ranges.
Understanding the Three Wyckoff Laws
Before making a trading decision based on the Wyckoff method, investors need adequate knowledge about the Wyckoff Laws. The Wyckoff accumulation method is based on three fundamental laws:
- Supply and Demand
- Cause and Effect
- Law of Effort and Result
Let’s take a look at the basics of the Wyckoff Laws:
The Law of Supply and Demand
This is the first and most important of Wyckoff’s laws. According to it, price moves with changes in supply and demand. We can demonstrate the first law with three equations:
- Demand > Supply: Price moves up
- Demand < Supply: Price moves down
- Demand = Supply: No change in price
Therefore, according to the Wyckoff law, traders will see a bullish movement as soon as demand exceeds supply. On the other hand, prices will move down when the supply is higher than the demand.
However, there is no way to determine the exact supply and demand from a price chart. Traders often compare price action with volume to correlate supply and demand to price.
The Law of Cause and Effect
Wyckoff’s second law states that the difference between supply and demand is not random. Rather, it has an underlying logic.
For his second law, Wyckoff uses two terms: accumulation and distribution.
Accumulation comes after a period of preparation, especially economic events. In this phase, accumulation (cause) leads to an uptrend (effect). Similarly, in the distribution phase (cause), price decreases, resulting in a downtrend (effect).
The Law of Effort and Result
According to Wyckoff’s third law, price moves due to an effort, represented by trading volume.
When the price action trading volume shows the same sentiment, the current trend has a greater chance of continuing. On the other hand, if the volume doesn’t support the price action, it will create a divergence in the price, leading to a stop or change in direction.
For example, let’s use the case of Bitcoin’s price moving higher and consolidating. During the consolidation period, volume is higher, but the price isn’t reaching a new high. Therefore, this is a sign that the volume and price are not showing the same sentiment. In this case, there is a greater possibility of reversal to the current momentum.
Wyckoff Price Cycle
According to Wyckoff, traders can anticipate price movement based on a detailed analysis of supply and demand that comes with studying price action and volume and with time.
Wyckoff observes the activity of successful traders, decoding their activity with what he refers to as vertical (bar) and figure (point and figure) charts. This method includes looking at how big players prepare and execute the bull and bear market in a price cycle.
 Wyckoff accumulation— markup and markdown phase.
According to the above image, investors should prepare for taking a buy position at the markup phase and sell positions at the markdown phase.
Supply and Demand
In the Wyckoff price cycle, the market direction is set according to the change in supply and demand. This is the core of Wyckoff’s method of trading and investing. Prices will move up once demand exceeds supply. Similarly, prices will move down as soon as supply exceeds demand.
Traders need to study the changing supply and demand, comparing them to price and volume over time. Patience and practice are required to master the art of accurately determining supply and demand from a chart.
Price Action
Price action is a process used to anticipate the price movement of any trading instrument by observing its price. It is an effective way to anticipate price movement, which also works well in the cryptocurrency market.
Most traders use candlesticks, trend lines, support resistance, and order flow, among other price action elements. The basic idea is that once a price breaks above any resistance level, it has a higher possibility of continuing its bullish pressure.
In the Wyckoff Cycle, the accumulation phase represents a range, and any breakout from the range with an appropriate price action may indicate strong bullish movement.
Volume
Price action alone is not enough to determine possible price movement from the Wyckoff accumulation area. Bullish movement from the accumulation area — or bearish movement from the distribution area — is valid once the volume has reached a certain level.
Traders are advised to find an appropriate price action with a substantial volume to consider the price movement as promising.
Time Frame
Timing is the most important element in the Wyckoff Cycle. The market cycle moves continuously from markup to markdown, and the perfect buying and selling position is valid only once the timing is right.
When the price remains within the trading range, traders can move to the lower time frame to perfect the trading entry. Here the ultimate target is to open a buy position once the accumulation is over and a sell position once the distribution is over.
The Composite Man Concept
Wyckoff proposed the “Composite Man” concept to understand the price movement of an individual trading instrument with the overall market context.
The composite man is a hypothetical person who has the capacity to move the price. He sits behind the scene and runs the game. Any manipulation of the price eliminates other traders’ hopes from the market. However, traders who know the composite man’s sentiment can survive the game and remain profitable.
In the cryptocurrency market, the composite man is also known as the — crypto whale.
Let’s see how to play the market game as the composite man plays it.
The Planning Stage
The composite man is brilliant. He knows how to trap retail traders in his campaign. He starts the game by attracting people to buy crypto assets, which he has already accumulated by making many transactions within a range.
Wyckoff believed that only smart traders could catch the composite man’s trap and find the opportunity to make profits from the beginning phase of a movement.
Accumulation Stage
Accumulation is the first phase of the Wyckoff price cycle. In this stage, institutional traders build orders and slowly gain powers that take the price higher.
The composite man aims to accumulate orders before starting his final move. Although the accumulation phase shows buying pressure, the price remains flat. Wyckoff suggests that traders closely monitor this phase and find a suitable buying position, using the price action and volume.
Broad Market Approach
Wyckoff used daily high, low, and closing prices to create a series of price charts. The main objective is to determine where the current market trend is heading. In this method, the trend is an important element, as it shows where the broad market is moving.
Whatever the composite man does to trap retail traders, he follows the market trend. Therefore, Wyckoff suggests that smart traders need to follow the footsteps of the composite man toward the broader market trend.
There are three possible trends: up, down, or flat. Furthermore, they exist in three different time frames: short-, medium- and long-term. The uptrend forms when the price makes a series of higher highs. The downtrend forms similarly, with multiple lower lows.
Sell-Off Stage
Once the accumulation phase is over, the price will move up with an increase in demand. However, most retail traders will jump into this buy party once the markup is over. But after the markup phase, there is no upside potential.
The sell-off stage appears after the markup that accumulates sales orders from a consolidation. According to Wyckoff, smart investors should avoid buying trades from the sell-off stage or close their buy positions before the sell-off starts.
Wyckoff Accumulation Schematics
In the accumulation schematic, the trading range represents the space between the SC low and the AR high. While secondary test usually happens when the market drops near the selling climax region to retest and confirm if the intense selling pressure is prolonged or ended.
Generally, during the accumulation phase, the price remains sidelined for range-bound trading after a strong downtrend. Larger players build positions and eliminate retail traders from the market by creating hopes of a further drop in the price. Once smaller fishes are confident about the price drop, bigger players aim to move higher after filling their positions.
According to Wyckoff, there are six stages in the accumulation phase. These stages include:
 Wyckoff accumulation schematics phases.
● PS — Preliminary Support: The preliminary support appears after a long bearish trend. Traders may experience a high volume and spread widening. It is the first indication that the selling pressure will end, and buyers may control the price.
● SC — Selling Climax: In the second step, the price begins to sell off, violating PS. This is a panic selling phase. After a while, the price may reverse after exhaustion, when the spread might extend to an extreme level. In the end, the price may close far from the low with a long-wicked candle.
● AR — The Automatic Rally: This part can be disastrous for sellers. After the violent selling pressure of the SC, the price reverses and recovers all the movement shown toward the sellers’ direction. This phase indicates that short sellers are covering their positions. The high of this movement determines the high of the range, which is a significant barrier for most buyers.
● ST — The Secondary Test: After the AR, the price will go lower again but controlled. In this movement, sellers’ volumes should be higher, and there may be multiple secondaries in the price.
● ST — The Spring: In this phase, the price will perform a hard test of recent lows that will mislead traders. After watching the spring, average traders will consider the market trend bearish and start selling trades. However, the price should show a swing failure pattern and move up after a shakeout. This phase is prevalent with altcoins that have bottomed out for a considerable time.
● AS — Accumulation Schematic: The last stage of the accumulation cycle. The price should break out from the range with an impulsive bullish pressure and confirm the upcoming bullish trend.
What Happens After Wyckoff Accumulation?
Once the Wyckoff accumulation is over, the price will move sharply higher as demand will exceed support. Buyers will experience an impulsive bullish pressure in which most money is generated from a buying position.
Wyckoff Distribution Schematics
In the distribution phase, the price remains sidelined after a strong uptrend. Larger players will now liquidate their positions, which may take the price lower after further steps.
There are four stages in the Wyckoff distribution phase. We will discuss them in this section.
 Wyckoff Distribution stages breakdown.
● PS — Preliminary Supply: The preliminary supply appears after a long bullish trend during which the high volume and spread increase. This is the first indication that the buying pressure will end, and buyers may control the price.
● CZ — Consolidation Zone: In the second step, the price starts to move within a range. In this phase, the volume and spread will be normal.
● LPSY — Last Point of Supply: After the CZ, the price will move up again, expanding in the spread and increasing volume. Thus, traders may think that the price will continue its bullish pressure. However, it will reverse immediately after breaking near-term highs.
● D — Distribution Marks: This is the last stage of the distribution schematic. The price should break below the range and restart its original movement.
The Five Wyckoff Approaches Trade Crypto
This section will look at the practical use of the Wyckoff method in the cryptocurrency market, including how traders can make trades.
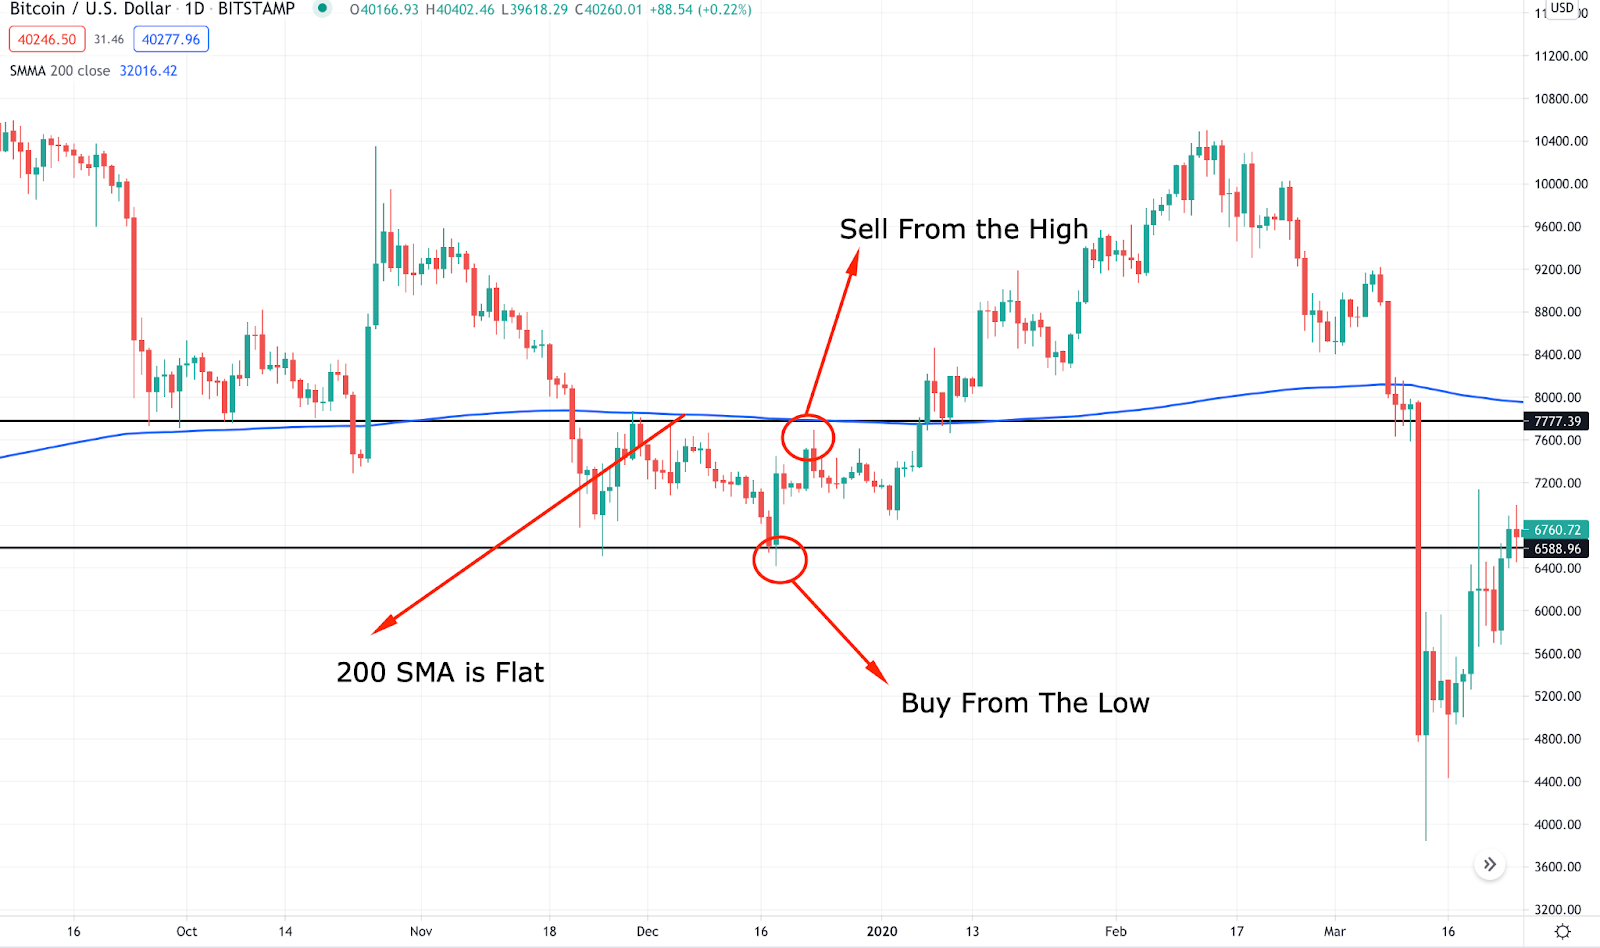
Range-Bound Strategy
First, find the 200 SMA as flat after a long bearish pressure for three to six months. Later on, mark the high and low of the range. To make a buy trade, find the price to reach the low of the range and subsequently get rejected.
Similarly, make a sell trade as soon as the price rejects the range high. Here the price may break beyond the range at any time, so be sure to use a tight stop-loss with some buffer.
Aggressive Entry
In the aggressive entry, traders should carefully read the price and find three key points of the accumulation phase. Once the spring is over, the price is ready to move. However, investors should focus on fundamental events besides the price action and volume to consider the bullish possibility is valid.

The above image represents a breakout happening, in this case, for Bitcoin. The price moves aggressively higher after the spring and holds its position bePowered by Tinyfore giving a 50% gain.
Conservative Entry
With the conservative approach, traders join the bullish trend after a strong breakout. When the price moves up from the spring, it won’t go straight to the target level. Rather, it will create some swings where traders can make trades with minimal risk.

The above image shows the price creating an event level where the resistance becomes support. After that, the price rejects the support with a bullish candle that provides a decent profit.
Reaccumulation Strategy
After accumulation, the price will move up. However, it will accumulate orders again — known as reaccumulation — if it wants to move more.
In the reaccumulation phase, the price will move sideways within a range. Then, before the breakout, it will squeeze to the support level, known as the “creek.”
The entry point is the resistance after the creek, and the stop loss will be below the support level.
Let’s look at an example.

How Reliable Is Wyckoff’s Theory?
The Wyckoff method is very effective for traders who want to catch the core part of a trend. However, it is not effective all of the time. In general, people usually buy from support and sell from resistance.
If a trader knows what the accumulation phase is and a price markup, making higher probability trades is easier. The technical analysis aims to identify future prices based on probabilities and predict the subsequent price movement in the cryptocurrency market. Wyckoff can help traders increase the possibility to analyze probable price targets and directions.
However, like other trading tools, Wyckoff has some limitations. In financial trading, no tool can guarantee a 100% profit. The market moves, and there is no guarantee that it will follow every step of Wyckoff’s theory. Even if you find all the Wyckoff steps in a price, there is no guarantee that you’ll end up with a profit.
Therefore, the reliability of the Wyckoff method depends on how you practice it — and how you follow all of its rules — while utilizing a strong money management system.
Final Thoughts
Wyckoff’s Accumulation theory was created almost 100 years ago, mainly for the stock market. But the prevalent use in the freely traded market proves that the method is more than just a technical analysis indicator.
Not only does the theory allow investors to hedge against all the fluctuations, but it also helps investors to understand the market cycles, price movements, and a probable future trend. Still, there are no guaranteed trading techniques. Trading and investing in cryptocurrency involves intensive research and close monitor of the market movement. Traders who wished to trade should always be wary of the risks and seek professional investment advice beforehand.
This article does not contain investment advice or recommendations. Every investment and trading move involves risk, and readers should conduct their own research when making a decision.