
Pinescript is Tradingview’s proprietary programming language, used for creating strategies, indicators and alerts on its trading and charting platform. The full reference can be found here: https://www.tradingview.com/study-script-reference/
Full code can be found at the bottom of the page!
Getting Started
This is tutorial for beginners, if you already know the basics and want to learn about more advanced topics like alerts and strategies, you can find them here.
First, you must have an account on tradingview.com once you’ve signed up, click “charts” and you’ll be met with a brand new chart. In the top left corner, you will see the current asset, in this case I’ll be using bitcoin as it has a lot of volatility.
At the bottom of the screen you will see “Pine Editor,” clicking there will bring up the Pine Script Editor, where we will be creating our indicator. Now we are ready to start.
Naming and Saving
Name your indicator by changing the text within the quotes like so:
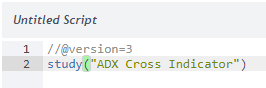
Today we’ll be creating a custom indicator called “ADX Cross” — this is based off of the “ADX” indicator, which indicates the strength of the current trend. The ADX can be a very useful tool when used in confluence with other indicators. After changing the text, hit ctrl + S to save the indicator. You will be prompted to name the indicator again, this is the name that will show above all else, the first will show only in the chart window. It is best to stick with the same name for both.
Creating Inputs
Inputs are numbers or options that will effect the output of the indicator. Sometimes they aren’t needed, however if you like to experiment or frequently change your variables, they are a necessity.
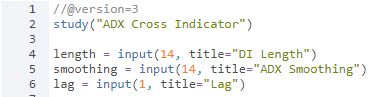
To create an input, we must first create a variable and set it equal to an input. Like so:
length = input(14, title=”Di Length”)
Length is a variable that we will use later on. We have just set it to an input, with a default value of 14, with a title “Di Length.” This will make more sense towards the end of the tutorial.
For this indicator, we will need two more inputs.
smoothing = input(14, title=”Smoothing”)
This input will be used to smooth the ADX
lag = input(1, title=”Lag”)
This input will be used and make sense later. Your script should now look like this:
Adding Variables
Variables are perhaps the most important part when creating a pine script indicator. These are values that change based on the current price, past prices or any combination of factors. It is up to you to decide what those factors are and how to best calculate them, for this tutorial however we’re going to create few pre-determined variables.
up = change(high)down = -change(low)trueRange = rma(tr, len)
The variable up simply equals the change between the previous bar’s high and the current bar’s high. The variable down equals the negative change between the previous bar’s low and the current bar’s low. The trueRange is set to equal a built in math equation, we don’t have to worry about quite yet as its done for us.
Adding and Calculating More Variables
We’re almost done, we just need a few more variables before we can plot our indicator. For the sake of simplicity, you can just copy the following onto your script.
plus = fixnan(100 * rma(up > down and up > 0 ? up : 0, length) / trueRange)minus = fixnan(100 * rma(down > up and down > 0 ? down : 0, len) / trueRange)
The variables plus and minus are set to equations that help create the ADX. This is explained a bit more in the video but essentially, it is a formula not unlike those used in high school to calculate velocity. Finally, the last two variables needed are:
sum = plus + minus
adx = 100 * rma(abs(plus — minus) / (sum == 0 ? 1 : sum), smoothing)
The variable adx is where it all comes together. It is set to equal 100 times the moving average of the absolute value of plus, subtracted by minus, divided sum and smoothing. Yea, its probably a tad confusing but thankfully, most of the work has been done but mathematicians or quantitative analysts and all we have to do is copy and paste! (unless you want to learn how they work which is cool if you’re into that)
Plotting
Finally, we’re at the end, where all the hard work comes together! We can now plot our indicator on the chart. To do this we need to use the plot() function, which is actually perhaps the easiest part. The function looks like this:
plot(adx, title=”ADX”, style=line, color=blue)plot(adx[lag], title=”ADX”, style=line, color=blue)
This will plot the variable adx on the chart. The second line will plot the variable adx on the chart, however it will be plotting the previous adx, creating a bit of a “shadow” effect, that will become more clear after adding the indicator to the chart.
Full Code
//@version=3
study(“ADX Cross Indicator”)length = input(14, title=”DI Length”)
smoothing = input(14, title=”ADX Smoothing”)
lag = input(1, title=”Lag”)up = change(high)
down = -change(low)
trueRange = rma(tr, length)plus = fixnan(100 * rma(up > down and up > 0 ? up : 0, length) / trueRange)
minus = fixnan(100 * rma(down > up and down > 0 ? down : 0, length) / trueRange)sum = plus + minus
adx = 100 * rma(abs(plus — minus) / (sum == 0 ? 1 : sum), smoothing)plot(adx, color=blue, title=”ADX”, style=line)
plot(adx[lag], color=red, title=”ADX”, style=line)
Add to Chart
Finally, after checking that the code you have matches the code above, click the button “Add to Chart” on the bottom right-hand side of the screen. You should have something that looks like this:
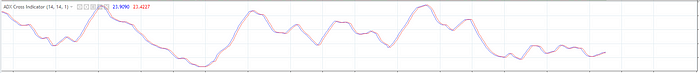
And you’re done!
This article does not contain investment advice or recommendations. Every investment and trading move involves risk, and readers should conduct their own research when making a decision.